


Sourcing Performance Metrics: Boost Reseller Profit
You can stand in a thrift aisle with a solid-looking pair of Nikes in your hand, check the tag, and still make the wrong buy. That's the problem with sourcing on gut feel alone. The item can look clean, the comps can look decent, and the fees can still eat the whole thing once you get home and run the math.
Sourcing performance metrics fix that problem before the money leaves your pocket. They tell you which finds are worth taking, which categories keep clogging the death pile, and which sources are just burning gas. If you're flipping at Goodwill, digging estate sale tables, or pulling from a pallet lot, the numbers should answer one question fast, buy or pass.
Table of Contents
- Why Sourcing Performance Metrics Matter at the Buy Decision
- The Core Sourcing Performance Metrics and Their Formulas
- A Walkthrough Using Real Sold Comps and Real Fees
- Where the Numbers Come From and How to Pull Them
- Benchmarks That Apply to Resellers
- Building a Simple Weekly Sourcing Dashboard
- When a Metric Goes Off and What to Change
- Putting the Metrics to Work This Week
Why Sourcing Performance Metrics Matter at the Buy Decision
The buy decision is where profit gets made or lost. Once you've already paid for an item, the room to fix a bad call shrinks fast. That's why spend under management matters in procurement, and the same idea matters for resellers, because the core question is how much of your spend is under control instead of drifting into impulse buys and maverick purchases, as defined in procurement analytics frameworks like Esker's overview of core procurement performance metrics (Esker).
The reseller version of that problem is familiar. You buy a “sure thing” jacket because the brand looks strong, then it sits for 120 days while the death pile grows around it. You drive to a dead store, spend on gas, and come back with nothing but a tote full of should-haves. The metric didn't fail, the habit did.
Practical rule: if a metric doesn't change what you buy this weekend, it's just decoration.
The metrics that matter most at the aisle are the ones that translate quickly into action. Hit rate tells you how many scanned items turn into buys. Net margin tells you whether a good sold comp still survives fees and shipping. Turn days tells you how long you'll wait to get the cash back. Sell-through rate tells you whether your sourcing mix is creating movement or clutter. ROI on sourcing time tells you whether that two-hour sourcing trip was worth the hours you put in.
That's the filter. Not “Did this item look promising?” but “Does it clear the profit bar after the full cost stack?” If the answer takes too long to find, the aisle gets expensive.
The Core Sourcing Performance Metrics and Their Formulas
Start with the buy-side numbers
A useful sourcing dashboard doesn't begin with vanity stats. It begins with the numbers that tell you whether your picking process is tight or sloppy.
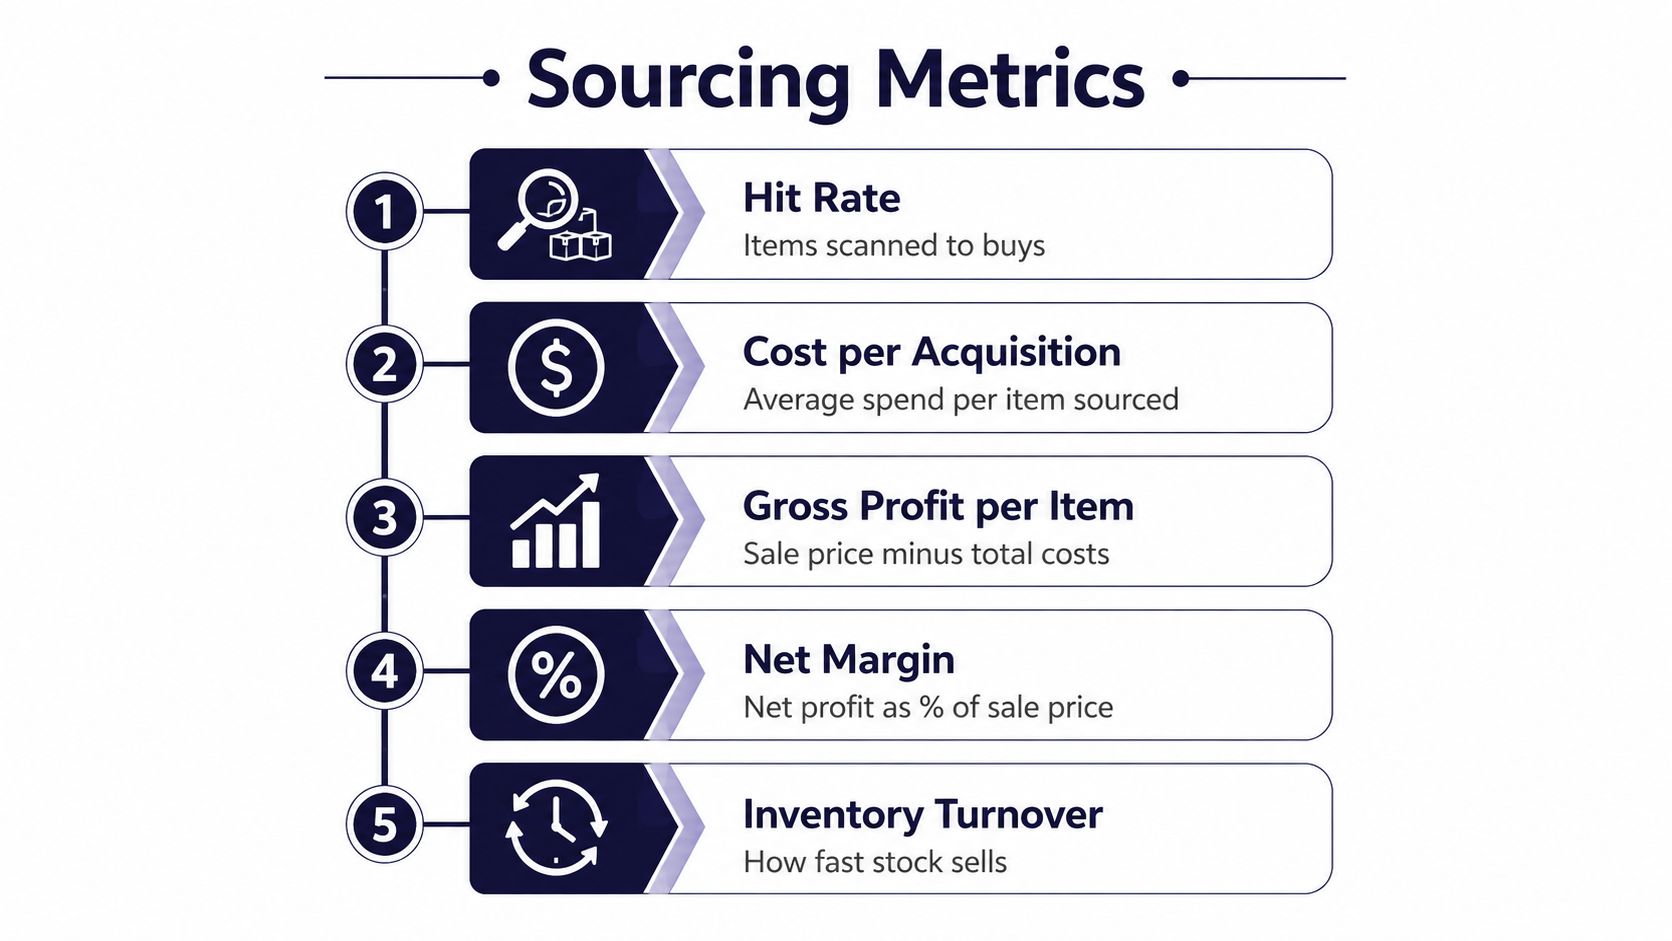
Hit rate = items scanned that you buy ÷ total items scanned.
A strong hit rate usually means your BOLO list is sharp and your category focus is narrow enough to avoid junk. A weak hit rate usually means you're scanning too much random stuff that never had a real path to profit.
Cost per acquisition = total sourcing spend ÷ number of items bought.
For resellers, this is just average cost of goods. A good number is category dependent, but if your average buy cost keeps creeping up while sell-through stays flat, you're overpaying for inventory that doesn't move.
Gross profit per item = sold price minus cost of goods.
This is the first profit check, but it's not enough by itself. A big gross profit can still disappear once fees and shipping show up.
Net profit per item = sold price minus cost of goods, fees, and shipping.
This is the number that matters after the marketplace takes its cut. The plain version is, “What did I really keep?”
Then add the speed and efficiency metrics
Net margin = net profit ÷ sold price × 100.
This shows how much of the sale you keep. Healthy categories tend to carry better net margins, but the true test is whether the margin justifies the sourcing time and shelf space.
Turn days = sale date minus buy date.
Shorter turn days mean your cash comes back faster. Longer turn days can still be fine on the right collectible, but slow turns on common inventory are dead money.
Sell-through rate = sold items ÷ total items listed or sourced in the category × 100.
This shows whether your buy decisions are producing movement. A shelf full of slow movers is usually a sourcing problem, not a pricing miracle waiting to happen.
Rule of thumb: margin without movement is storage. Movement without margin is busywork. You need both.
ROI on sourcing time = net profit ÷ hours spent sourcing.
That one is easy to ignore and hard to fake. If a weekend sourcing run takes five hours, the haul should justify the time, not just the cash outlay.
If you want a clean breakdown of profit math, the simplest reference point is a straight net-profit formula you can keep beside your spreadsheet, like the one in this net profit guide.
A Walkthrough Using Real Sold Comps and Real Fees
A sealed Nintendo 64 game at a Goodwill shelf is a perfect test case because the buy is simple and the math can still fool you. Say the tag is $4.99, and recent sold comps on your marketplace search put the sale price at $49.99. That sounds decent until fees and shipping enter the picture.
The numbers on one item
Let's use a plain resale path:
- Buy cost: $4.99
- Sold price: $49.99
- Marketplace fee and payment cost: use the marketplace's published schedule for the platform you sell on
- Shipping: your actual outbound label cost
- Packaging: mailer or box, if you track it in your cost stack
The first pass is gross profit.
Gross profit = $49.99 minus $4.99 = $45.00
That looks strong, but gross profit is the version people brag about before reality shows up. If fees and shipping total even a meaningful chunk, the take-home changes fast.
Now run net profit.
Net profit = sold price minus cost of goods, fees, and shipping
If fees and shipping together are $13.50, then:
Net profit = $49.99 minus $4.99 minus $13.50 = $31.50
That's still a healthy flip. But if the game sells slower than expected and ties up shelf space for a month, the return looks different. Turn days matter because a $31.50 profit that takes 90 days to realize is not the same as a $31.50 profit that lands in two weeks.
Why the same math can kill a bad buy
A vintage jacket can look just as good on the rack and still come out weak. If it sells for a solid comp but the platform fees are higher, the shipping box is larger, and the item took a longer time to move, the margin shrinks fast. That's why apparel flips need tighter buy rules than media or small electronics.
You don't need fancy accounting to see the pattern. You need the sold comp, your real buy cost, the platform fee, and the shipping label before you decide. If those four numbers don't clear your threshold, the item stays on the shelf.
Reseller truth: a good comp is only half the story. The other half is what you keep after the platform and the post office get paid.
Where the Numbers Come From and How to Pull Them
The fastest way to get honest sourcing data is to stop treating comps like a separate research project. Pull sold comps from the places you already check, then keep the fee and shipping inputs close enough to use in the aisle. That's the difference between “I'll look it up later” and a real buy decision.
The raw inputs you actually need
For each item, you want four things:
- Sold comp price from marketplace sold results
- Fee estimate based on the platform you'll sell on
- Shipping estimate based on weight and dimensions
- Buy cost from the shelf, bin, or table
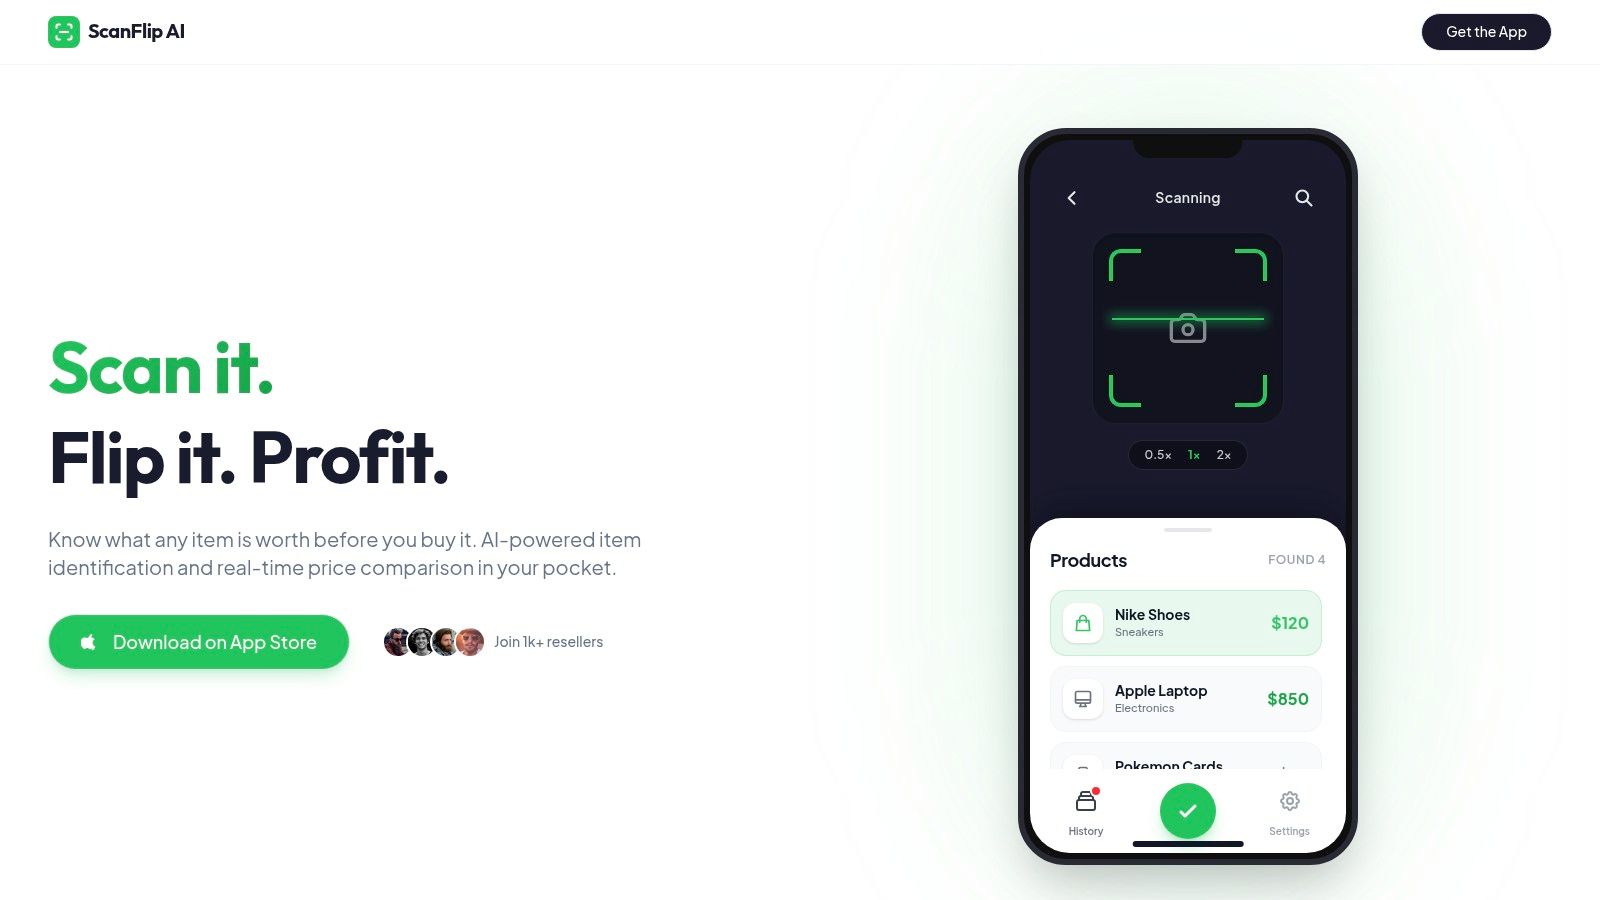
A tool like ScanFlip AI is built for the sourcing moment, not the listing phase. It uses AI photo scan with no barcode needed, barcode scan, and text search, then pulls sold comps across eBay, Poshmark, Mercari, Depop, Amazon, Whatnot, ThredUp, Facebook Marketplace, and TikTok Shop, while also showing expected net profit after fees and shipping. That's useful when you're standing in a Goodwill aisle and don't want to toggle through apps while somebody else grabs the item.
How to keep it usable
The mistake is building a giant spreadsheet you won't touch after Tuesday. Keep a weekly sheet with just enough detail to see patterns. Track store name, category, item type, buy cost, sold comp, net profit, turn days, and whether you bought or passed.
A simple scan log is enough to start spotting where the money is. One thrift store may look bad overall but produce strong media flips. Another may be packed with tempting clothing but weak on actual sold comps. That kind of pattern only shows up if you record your decisions.
Crosslisting tools like Vendoo and List Perfectly can still help on the back end, but they don't answer the aisle question. They sit after the buy. The sourcing metrics have to work before the cash leaves your wallet.
For a practical way to find sold comps on the market itself, keep this reference handy: how to find sold prices on eBay.
Benchmarks That Apply to Resellers
Benchmarks only matter if they fit how resellers buy. A thrift flipper, a card seller, and a pallet buyer do not live in the same inventory reality, so one clean range will never fit every category. The useful part is knowing when your numbers are clearly strong, clearly weak, or just drifting.
| Metric | Stronger signal | Softer signal | Problem signal |
|---|---|---|---|
| Hit rate | 25% to 40% of scans turning into buys for sourced candidates, based on talent-sourcing benchmarks that show strong outreach performance (Pin sourcing benchmarks) | Below that but still selective | Very low, which usually means poor targeting or bad category focus |
| Sourced-to-interview style conversion | 30% to 50% as a useful funnel benchmark in recruiting research, adapted here as a reminder to measure mid-funnel conversion, not just scans | Middle of the road | Thin conversion after the first yes |
| Net margin for clothing | 40%+ after fees and shipping is the kind of zone that usually feels worth the effort | Thin but workable | Too little room left after costs |
| Net margin for books and media | 30%+ after fees and shipping is often acceptable because turn can be faster | Borderline | Not enough profit for the time spent |
| Turn days for media | Around 30 days is a strong move for fast inventory | Slower but usable | Stale inventory that's sitting too long |
| Turn days for vintage apparel | 60 to 90 days can still be normal | Stretching beyond that needs review | Too slow for the category |
| Turn days for collectibles | Up to 120 days can be fine when margins justify it | Longer than expected | Stagnant without a premium price story |
| Sell-through rate | 70%+ is solid | Below that needs attention | Under 50% suggests a sourcing problem |
| Sourced hires to inbound hires style ratio | Mature sourcing teams can run at an 8x sourced-to-inbound hire ratio in talent sourcing benchmarks | Not directly comparable to reselling, but useful as a reminder that proactive sourcing should beat passive flow | If sourced items do not beat passive finds, your sourcing edge is thin |
The right way to use these numbers is as ranges, not commandments. A sealed wax box might sit longer because the margin story is stronger. An old paperback should not sit like a collectible grail. Category context matters more than a single headline percentage.
The Hackett Group's way of grouping normalized spend performance, total cost savings, supply/value chain performance, and supplier performance is useful here because it keeps the scorecard balanced instead of focusing on one number. Resellers need the same balance. Good sourcing is not just cheap buys. It is controlled spend, decent margins, and inventory that moves.
That same balance is why a profit calculator app can help while you are still building your own routines. A quick check of fees, shipping, and net profit keeps you from buying items that look fine in the aisle but do not hold up after costs. profit calculator app
Building a Simple Weekly Sourcing Dashboard
A weekly dashboard should fit on one screen and one glance. If it takes an hour to understand, it's too much. The best one shows whether your sourcing habits are tightening or drifting, and it does that without turning into a project.
What to put on the page
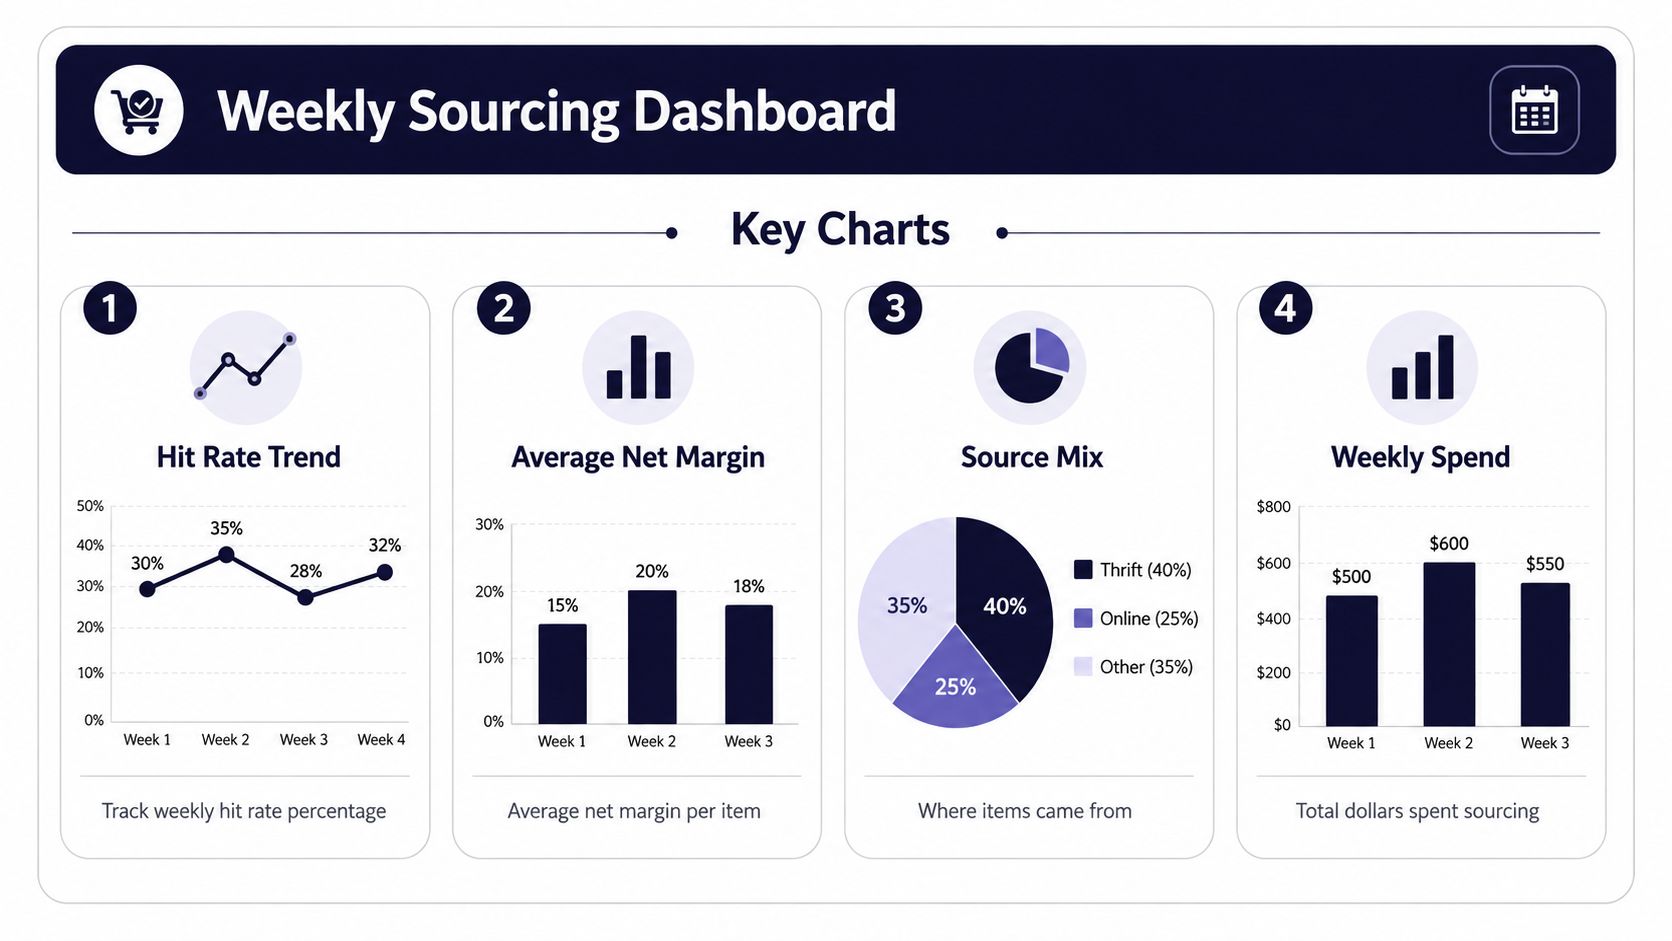
Use a single Google Sheet or Notion page with these blocks:
- Hit rate trend by week
- Average net margin by category
- Turn days for sold inventory
- Sell-through rate by category
- ROI per sourcing hour
Keep a summary box at the top with this week's numbers next to last week's. Use a simple color rule, green when a metric clears your bar, red when it doesn't. No fancy dashboarding needed.
If you want a calculator-style helper for quick math while you're still building your own sheet, the plain way to think about it is the same way sellers think about profit on a flip, which is why a profit calculator app can be useful as a sourcing check even before you build your own routines.
How to make it useful on Sunday night
One line of commentary beside each chart is enough. If hit rate dipped, note whether you scanned too many low-value categories. If turn days are stretching, note which category is dragging. If sell-through is soft, mark the source that keeps producing dead inventory.
Keep the dashboard close to the next buying trip. If it can't change what you do at the next estate sale, it's not a sourcing dashboard, it's paperwork.
The point is to answer the next weekend's decisions. Go heavier on the categories that are moving. Cut the ones that keep producing slow flips. Tighten the thresholds on the items that look good but don't survive fees.
When a Metric Goes Off and What to Change
A metric going red only matters if it changes the next trip. If hit rate falls, don't just frown at the sheet. Figure out whether you're scanning the wrong categories, using the wrong minimum profit threshold, or chasing items with weak sold comps.
Two common failure patterns
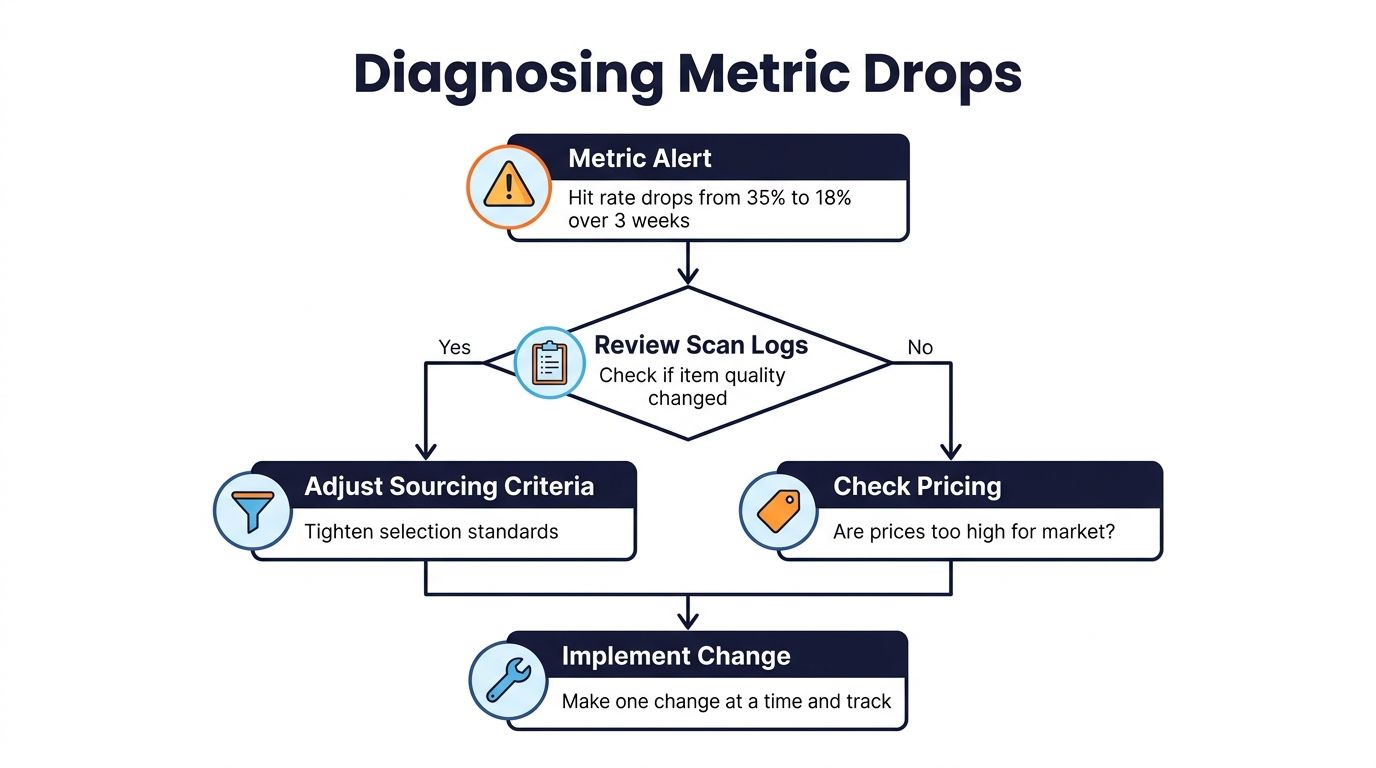
If hit rate slides from 35% to 18% over a few weeks at the same thrift chain, the issue is usually category drift. You're probably scanning too much low-value stock because the aisle feels busy and promising. The fix is to tighten the BOLO list and raise the minimum profit threshold, not to keep scanning harder.
If turn days stretch from 40 days to 95 days on vintage jackets, the problem may be oversaturation or soft recent sold comps. Recheck the sold prices, reprice if the market has moved down, or step out of that category for a while. A category can look stylish and still be a bad use of cash if it's clogging your racks.
How to diagnose without guessing
- Check the scan log: see whether the mix of items changed.
- Look at the sold comps again: make sure you're not using stale pricing.
- Adjust one thing at a time: change the threshold, the category, or the source, not all three.
- Track the next week: measure whether the change helped.
The fix should always be tied to the cause. Bad item quality calls for tighter sourcing criteria. Good items with weak margins call for pricing discipline. Solid margins with slow turns may just mean the category isn't worth your time right now.
Putting the Metrics to Work This Week
If you can only track three numbers, make them net margin, hit rate, and turn days. Those three tell you whether you're buying profitably, selecting well, and getting cash back fast enough to keep the machine moving. Keep sell-through and ROI on sourcing time right behind them if you want the fuller picture.
The goal isn't a prettier spreadsheet. It's fewer bad buys, faster decisions, and less dead stock. Pick three metrics, pull this month's numbers, set one threshold to improve next month, and recheck at the end of thirty days.
If you want a faster way to make the buy-or-pass call while you're still in the aisle, ScanFlip AI gives you sold comps, fee-aware net profit, and a clear verdict without guessing. It's built for the sourcing moment, which is exactly where these metrics matter most.