


How to Calculate Sell Through Rate: A Reseller’s Guide
You're in a Goodwill aisle with a $6 jacket in one hand and a phone full of sold comps in the other. Twenty of those comps closed. Forty are still sitting. Someone nearby says the category "sells through at 70%." That number doesn't tell you whether to buy until you know what sat in the denominator, over what window, and whether the sale still clears fees.
How to calculate sell through rate is mostly a denominator problem. Units sold divided by the wrong pile will make a death pile look healthy, or make a clean sourcing batch look dead. I wouldn't buy off a percentage until it's tied to one inventory pool, one time window, and a net profit per item.
Table of Contents
- The Sell-Through Rate Formula and Which Denominator to Use
- How to Calculate Sell-Through for One Sourcing Batch
- Calculating Sell-Through by SKU, Category and Time Period
- Turning Sell-Through Into Net Profit Per Item
- Why a High Sell-Through Rate Can Still Be a Bad Buy
- Fixing a Low Sell-Through Rate
- Tracking Sell-Through From Scan History and Sold Comps
- Confirm Your Flip-or-Pass Rule Before the Next Sourcing Trip
The Sell-Through Rate Formula and Which Denominator to Use
Pull 600 sweaters from a wholesale clearance haul. Over eight weeks, 333 of them sell. WisePIM's sell-through guide runs the basic sourcing-batch math as units sold divided by units received, multiplied by 100: 333 ÷ 600 × 100 = 55.5%. That sell-through rate (STR) means something only because the window is eight weeks and the pool is that one haul.
Restocking is where the rate gets dishonest. Start a month with 100 items, add 50, and sell 60. Divide 60 by the original 100 and you print 60%. Divide by everything that was available, 150, and you get 40%. The second figure matches a thrift week or a retail-arbitrage run, because sourcing doesn't stop at one pile.
Match the denominator to how you buy
One-time buys need a third base. With no opening stock, use sold divided by sold plus still-active units. Thirty sold and thirty still listed is 30 ÷ 60 = 50%. Counting only what you bought this morning, while ignoring what's already listed, overstates demand.
| Method | Denominator | Example | Result |
|---|---|---|---|
| Basic period rate | Units received | 333 sold ÷ 600 received | 55.5% |
| Replenished period rate | Beginning inventory + units received | 60 sold ÷ (100 on hand + 50 added) | 40% |
| Sourcing batch rate | Sold + still-active units | 30 sold ÷ (30 sold + 30 active) | 50% |
| Opening stock with receipts | Beginning inventory + receipts | 180 sold ÷ (200 on hand + 100 added) | 60% |
The last row is the death-pile version. WisePIM's worked case is 180 sold out of 200 already on hand plus 100 added, which lands at 60%, because it counts stock that was available to sell, not just new receipts.
Practical rule: Every STR needs a stated time window and a named inventory pool. A 7-day sold count never gets divided by a 30-day inventory base, and a category's 30-day rate is not the same signal as one jacket's 12-month history while you stand in that aisle.
How to Calculate Sell-Through for One Sourcing Batch
Say the haul is Pendleton wool shirts. You pull 12 off a Goodwill rack, find 8 more on a later trip, and 15 sell inside 30 days. The cohort is 20 shirts. The rate is 15 ÷ 20 × 100 = 75%. The steps below are what make that 75% checkable later, instead of a number you can't defend.
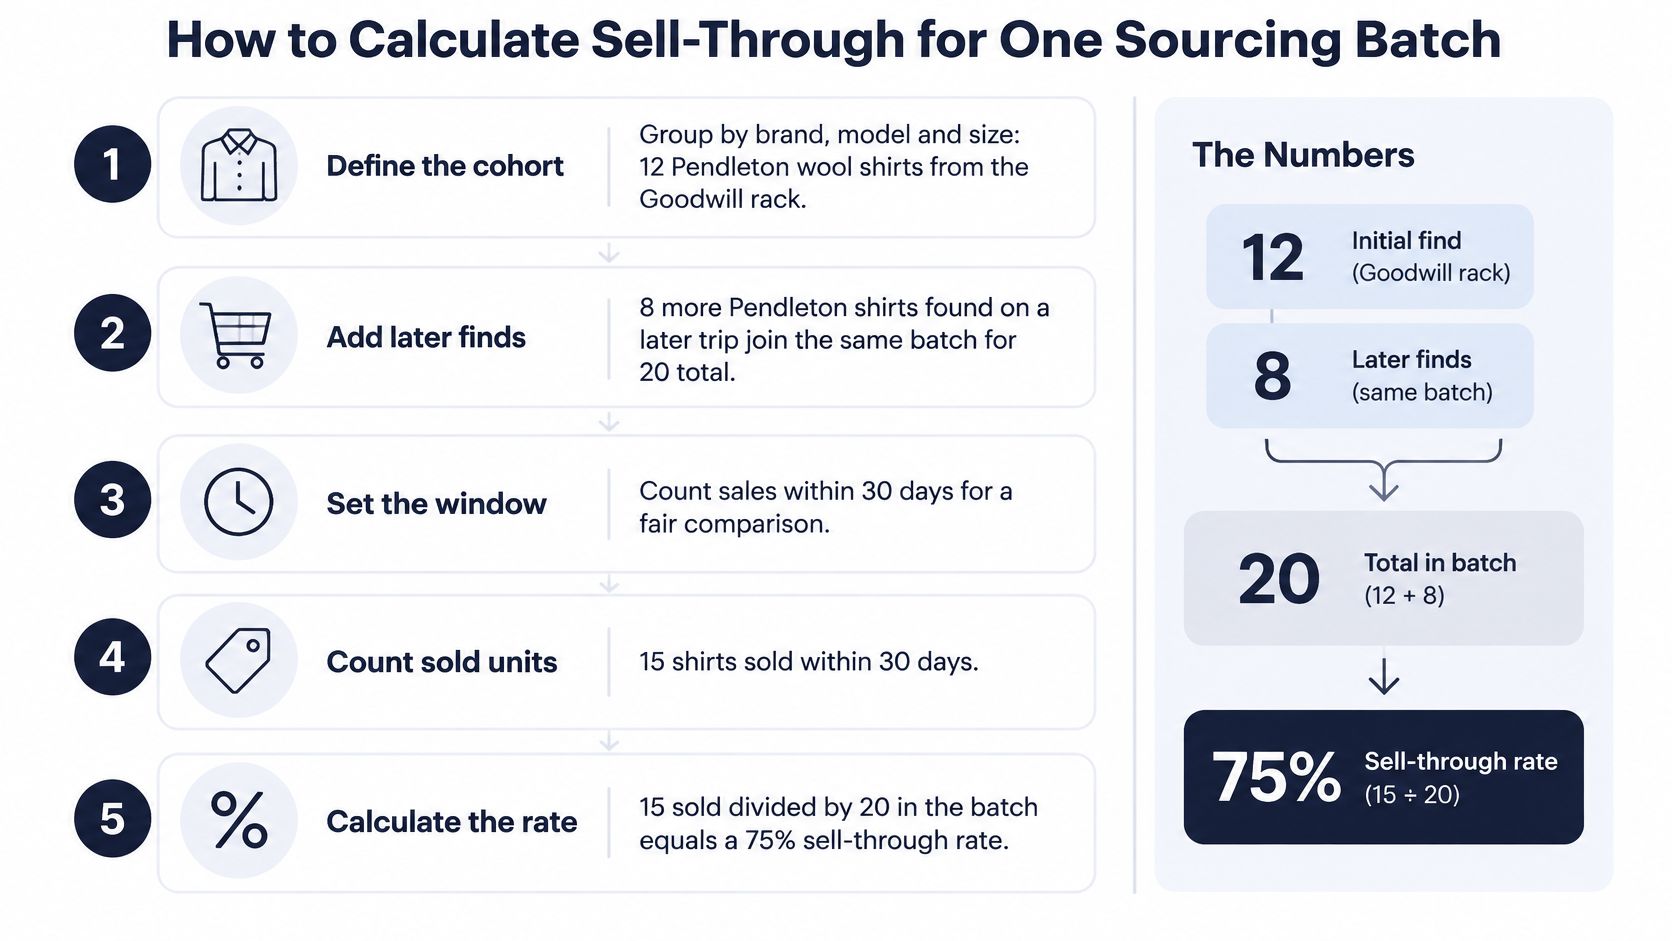
- Define the cohort. Count only shirts that match on brand, model, size, condition, and channel. A size large in good condition on eBay is not the same unit as a small with moth holes on Poshmark. Mixing them hides which version sold.
- Set the window before you count anything. Start the clock on the day the first shirt lists, and lock it at 30 days. A shirt that sells on day 31 belongs to the next window. Sliding the end date after you see a sale is how a slow batch gets dressed up.
- Count opening stock at the window start, which is 12. Use the count from that morning, not whatever is on the rack tonight. Replacing the start count with today's count punishes you for sales you already made.
- Add units received during the window, which is 8. Late thrift finds join the same cohort if they match step 1. Don't add a relisted sold shirt as "new stock." That inflates the denominator and drags a real sale back toward zero.
- Count units sold in the window, which is 15. Completed sales only. Leave out canceled orders, returns, and a bundle you split into separate listings. A return is not a sale, even if the money sat in your account for a week.
- Divide sold by opening plus received. That's 15 ÷ (12 + 8) × 100 = 75%. Write the three inputs next to the percentage. A bare 75% can't be audited when you look back in two months.
- Record still-active units on their own line. Five shirts didn't sell. They become opening stock for the next window, not a fresh receipt. If you don't split them out, the next batch inherits old inventory and the rate stops meaning anything.
What to keep in the log: cohort description, window start and end, opening count, receipts, sold count, still active, and the rate. If any of those cells is blank, don't use the percentage to decide the next trip.
Calculating Sell-Through by SKU, Category and Time Period
A 50% sell-through rate can describe fast-moving inventory or a slow seller, depending on what went into the denominator. Compare SKUs, categories, and time periods using the same window and a consistent count of available units.
SKU means one specific item type, such as a Levi's 501 in a particular waist, inseam, wash, and condition. Category groups related SKUs, such as all Levi's 501s or all Nike tees. Period can mean a sourcing trip, month, or quarter. For example, if 40 comparable units were listed at the start, 20 more arrived, and 30 sold within 30 days, the rate is 30 ÷ (40 + 20) = 50%. For a one-time source with no opening inventory, divide units sold by sold units plus unsold active units. Keep conditions consistent, and exclude canceled orders and returns.
Weight units, not percentages
When rolling up SKUs, add the units sold and the units available, then divide once. A five-unit SKU at 100% should not carry the same weight as a 200-unit SKU at 40%. Averaging those percentages gives 70%, even though the larger, slower SKU accounts for most of the stock.
A 90-day category check might show tees at 70%, shoes at 45%, and collectibles at 20%. The category breakdown shows where the difference lies: tees may move more quickly, while shoes can be held back by size and condition, and collectibles may take longer to find a buyer. A single store-wide rate hides those distinctions.
| Category | Typical window | Typical STR range | Note |
|---|---|---|---|
| Fashion apparel | 30 days | 60%–80% | Seasonal pieces may need a window covering the full season |
| General retail categories | 60 days | 40%–60% | Use as a starting point, not a universal target |
| Trading cards and collectibles | 90 days | Build from your own sold comps | One-of-a-kind lots vary |
| Books and media | 30 days | Build from your past batches | Compare similar ISBNs |
Use the table's ranges as working reference points, not official standards. Set the measurement window to fit the inventory: 30 days is a practical check for many apparel and home goods items, while seasonal pieces and collectibles may need 60 to 90 days. For cards and books, compare similar batches against your own sold comps. A category rate is useful for deciding what to source again; it does not show whether each sale leaves enough profit.
Turning Sell-Through Into Net Profit Per Item
A jacket costs $6 and sells on eBay for $42 with free shipping. The buyer pays $42, so the full amount is the fee base; the $4.50 shipping label comes out of the seller's proceeds. The eBay seller fee page lists final value fees from 2.5% to 15.3% by category, calculated on the total sale amount, including shipping. Orders above $10 also have a $0.40 per-order fee.
The $42 sale, line by line
At a 13.25% fee rate, the percentage fee on $42 is $5.57. The reseller's calculation is $42 − $5.57 − $0.40 − $4.50 − $6 = $25.53 net profit.
| Line item | Amount |
|---|---|
| Sold price | $42.00 |
| eBay final value fee (13.25%) | -$5.57 |
| Per-order fee | -$0.40 |
| Shipping label | -$4.50 |
| Cost of goods | -$6.00 |
| Net profit | $25.53 |
Estimate expected net profit by taking the median sold-comps price, then subtracting platform fees, shipping, other costs, and buy cost. Use sold comps rather than the highest active asking price. For the full sequence of costs to include, see this guide to calculating net profit.
A 70% sell-through rate at $3 net per item can produce less profit than a 35% rate at about $25 net per item, especially if those items clear in two weeks. Sell-through shows how often inventory sells; net profit per sold item shows what each sale contributes. Calculate both before deciding whether an item is worth the shelf space and listing work.
Why a High Sell-Through Rate Can Still Be a Bad Buy
A vintage jacket sells within days, but its low sale price leaves little after costs. A slower-moving jacket with a stronger net may be the better buy. Sell-through depends on more than demand: listing quality, search visibility, platform, price, condition, season, and geography all affect what gets sold.
Three checks help separate a strong rate from a sound buy.
Check the sample size. Four sales out of five comparable listings is a thin signal, not proof of steady demand. With fewer than about ten comparable sales, treat the rate as a rough estimate. A small sample can swing sharply with just one sale.
Compare price with competition. Underpricing can make an item sell quickly while leaving little profit. Compare sold listings with active ones, then check the median sold price and calculate net profit before buying.
Look below the category average. Interest in decade-specific fashion searches has been growing, but a broad category average can hide which subcategories are selling. A narrow pocket of demand may not hold, so check the exact item rather than relying on the category label. Market demand forecasting helps frame that check around likely demand for the specific item.
A low rate can reflect weak exposure, a title missing the model number, or an asking price above sold comps. It does not automatically mean demand is weak.
The buying question is specific: how likely is this item to sell within your target time, at a price that clears your minimum net profit? A high sell-through rate matters only when the denominator is useful and each sale leaves enough profit.
Fixing a Low Sell-Through Rate
Start with price. Reprice to the median of sold comps for that exact item, not the top of active listings. An item listed at $42 while three sold comps closed at $28 will sit, and the STR will blame the product.
Then the title. Put the model number, size, and the words buyers type in the first line. If search never surfaces the listing, the rate is measuring your title, not the market.
Photograph the flaw you'd rather hide. A faint stain or a broken zipper, shown in the photos, beats a return and a stale relist. Undisclosed defects don't just cost the sale. They reset the clock.
Compare sold comps by channel and move the item to where the same item sold faster. eBay, Poshmark, Mercari, and Whatnot don't share one buyer. Inventory tips from Menza are worth a read when you're deciding what stays listed and what gets cleared so the next window isn't full of leftovers.
Set the markdown before the item goes stale. Drop 10% at day 30, another 10% at day 45, and at day 60 send what's left to the death pile or a bundle. Log each change with its date. The next window then shows whether the change worked, instead of mixing three prices into one rate.
Tracking Sell-Through From Scan History and Sold Comps
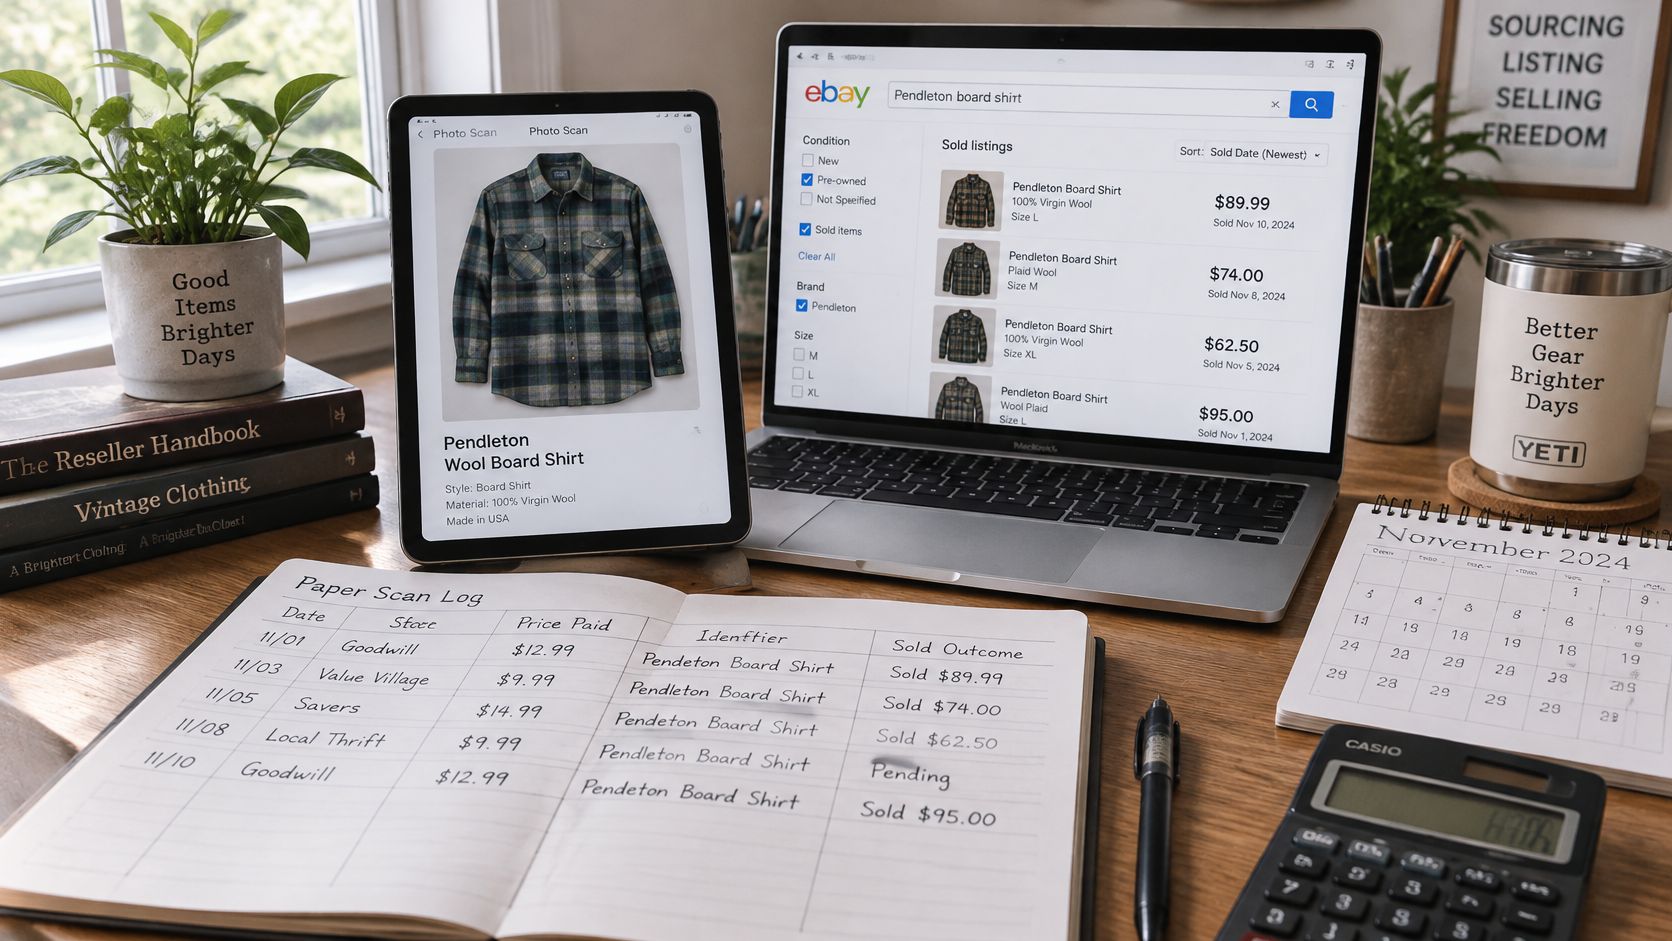
A useful batch record connects each scan to its outcome. For an estate-sale Pyrex lot, log the date, sale location, amount paid, pattern, and whether each piece sold within the chosen window. If six pieces were scanned and four sold within 30 days, the batch sell-through rate is 4 ÷ 6 = 67%. Keep unsold pieces in the denominator.
What a sold-comp row needs
A sell-through rate signals demand, not profit. Filter sold listings by brand, exact model or edition, size, condition, and sales channel. Record the time window, sold count, active count, median sold price, and days to sale. For context on how to identify relevant results, see this guide to recent sold prices. Then calculate net profit per sold item by subtracting platform fees, shipping, other costs, and buy cost from the median sold price.
Active listings change the interpretation. Four sold against two active listings suggests a different level of competition than four sold against forty active listings. Remove duplicate, stale, and misidentified listings before counting, and use the same window, such as 30, 60, or 90 days, across the batch. Separate seasonal goods from evergreen goods so unlike items do not distort the comparison.
A receipts-only calculation can also mislead after restocking. If 30 units sell and only 10 new units arrive, dividing sold units by new receipts produces 300%. That figure excludes opening inventory, so it does not describe the sell-through of the full stock available.
ScanFlip AI is designed for sourcing decisions, not listing or bookkeeping. Scan an item with the camera, compare real-time sold comps across six major reselling platforms, and see profit after fees and shipping. Its scan history records photos, locations, and timestamps, giving you details to carry into your batch log. Crosslisting and inventory management still belong in tools such as Vendoo or List Perfectly. Record sold comps rather than asking prices, then use net profit per sold item to judge whether a strong rate translated into a worthwhile buy.
Confirm Your Flip-or-Pass Rule Before the Next Sourcing Trip
Write the rule down before you walk into the next sale. A percentage you invent in the aisle will always agree with the item you already want.
- Pick the minimum net you'll accept, such as $10 after fees and shipping.
- Set an STR floor from your category baseline, such as 40% for general retail or 60% for apparel.
- Lock the window, 30 days for most items, and don't move it mid-batch.
- Pull sold comps, not asking prices, and let the fee and shipping math produce take-home. Our automatic profit calculator computes fees and shipping so that figure is the take-home, not a guess.
- Buy only when both the net and the rate clear. The flip-or-pass verdict is a red or green signal against the minimum margin you set. Write the decision either way: item, price, comp count, and window.
Log every pass as well as every buy. The passes are where you find out which of your numbers were wrong.
ScanFlip AI is the check you run before the cash leaves your hand: sold comps, fees, shipping, and a red or green call against the margin you already set. Use it on the next Goodwill aisle, garage-sale bin, or Ross rack so the sell-through rate and the net profit get answered together. Open ScanFlip AI and set your minimum before the next sourcing trip.