
Market Demand Forecasting for Resellers: A Practical
You can stand in a Goodwill aisle, holding a vintage jacket that feels like a winner, and still end up with dead money in your death pile. I've made that mistake enough times to know the feeling. The fix isn't better vibes, it's market demand forecasting, which in reselling just means checking what people buy before you hand over cash.
When you source with sold comps, velocity, and a simple buy rule, you stop paying for hope. That matters because demand forecasting errors are expensive at scale, and one 2026 industry compilation says they cost manufacturers an average of $1.2 million per facility each year while 60% of forecasts overestimate demand (worldmetrics.org). The same source says accuracy improves when companies use richer inputs, including a 30% higher demand-forecast accuracy rate when social media trends are incorporated and a 25% improvement when predictive analytics are added (worldmetrics.org).
Table of Contents
- Why Gut Instinct Fails at the Thrift Store
- Defining Your Sourcing Goals and KPIs
- Gathering and Cleaning Sold Comps and Velocity Data
- Applying Simple Quantitative Methods in the Aisle
- Setting Buy and Pass Thresholds with ScanFlip AI
- Common Forecasting Mistakes That Kill Profit
Why Gut Instinct Fails at the Thrift Store
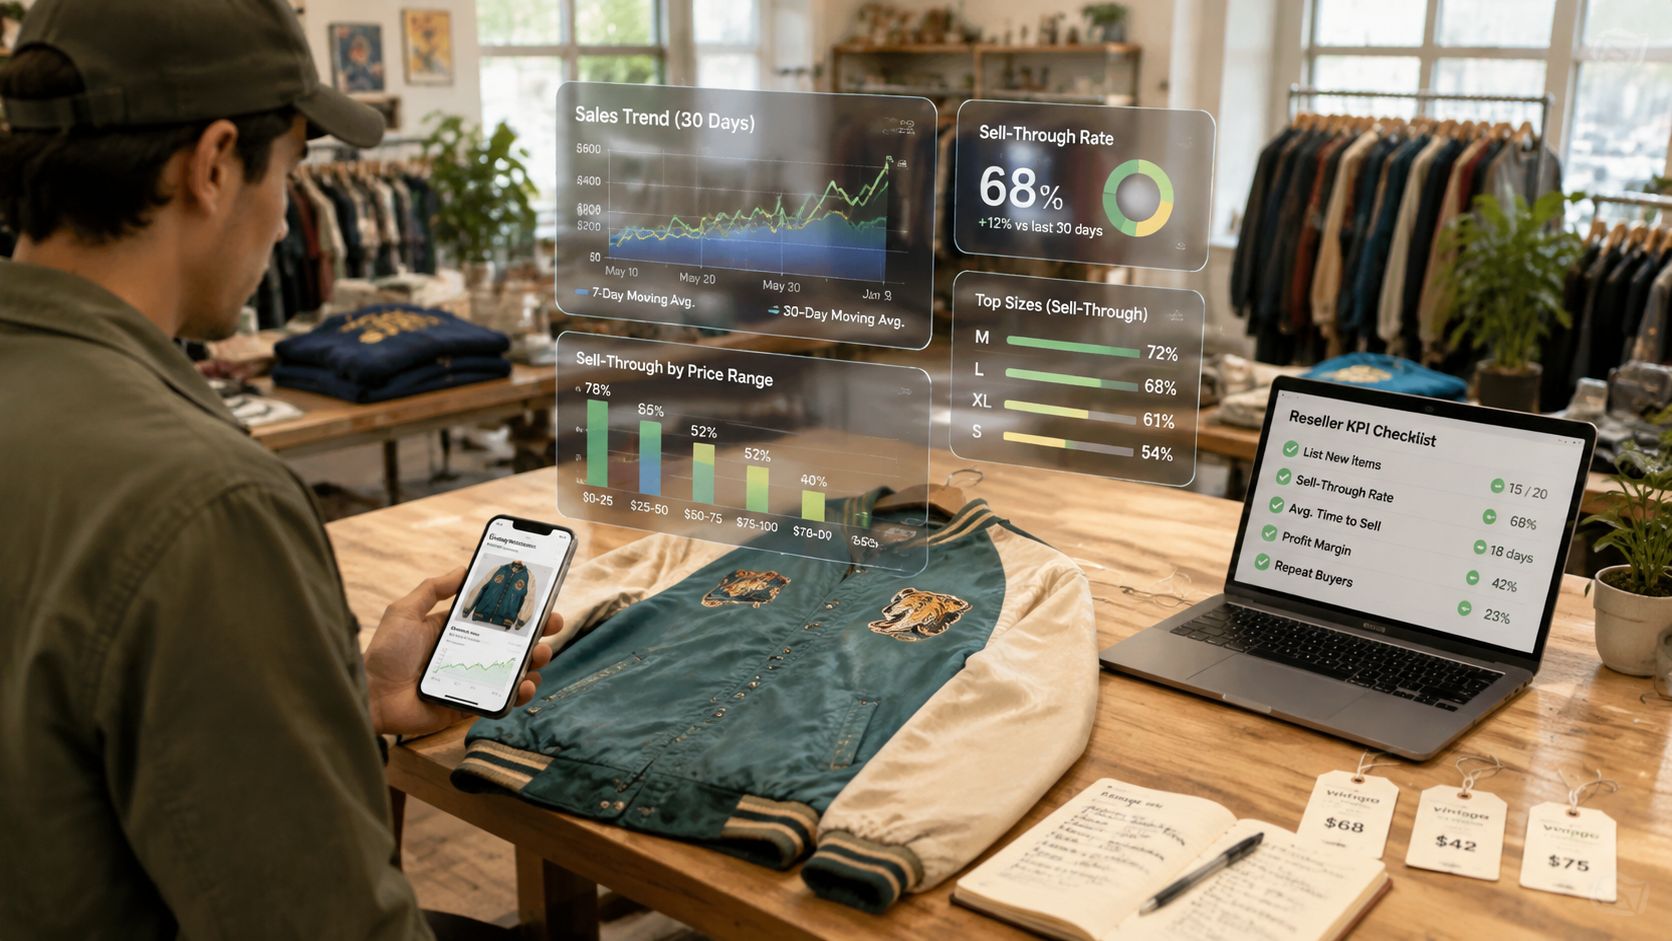
You're standing in front of a rack at Goodwill with a vintage jacket in your hand. The fabric feels right, the label looks old enough to matter, and your gut says buy. Three months later it's still in the death pile because nobody wanted it at your price, and the cash you tied up could have gone into something that moved fast.
Market demand forecasting keeps that mistake from happening so often. It starts with a simple question, “Will this sell, and how fast?” before money leaves your pocket. If you have ever watched a good-looking item sit for weeks while cheaper, uglier, more boring stock moved first, you already know why instinct alone gets expensive.
Gut feel is loud, sold comps are louder
A reseller who guesses off vibes will overpay for the jacket because it “feels BOLO.” A reseller who checks sold comps, sell-through rate, and recent velocity in under a minute makes a better call. In the aisle, that difference shows up fast, because one approach creates cash flow and the other creates clutter.
Practical rule: if you cannot explain why an item should sell in your target window, it is not a buy, it is a gamble.
IBM describes demand forecasting as a supply-chain process that uses historical data, compares outputs against past patterns, and monitors forecast accuracy over time so organizations can refine assumptions (IBM's demand forecasting overview is summarized in the verified data). Resellers use the same logic at a smaller scale. You are not trying to predict the universe, you are trying to avoid buying the wrong inventory with your own cash.
The old habit is to treat every cool item like a winner. The better habit is to treat every item like a small investment decision. If the comps are thin, the demand looks soft, or the category is dead, walk away.
The aisle does not reward confidence on its own. It rewards repeatable checks, a quick read on velocity, and the discipline to pass when the numbers are weak. That is the difference between a full cart and a profitable one.
Defining Your Sourcing Goals and KPIs
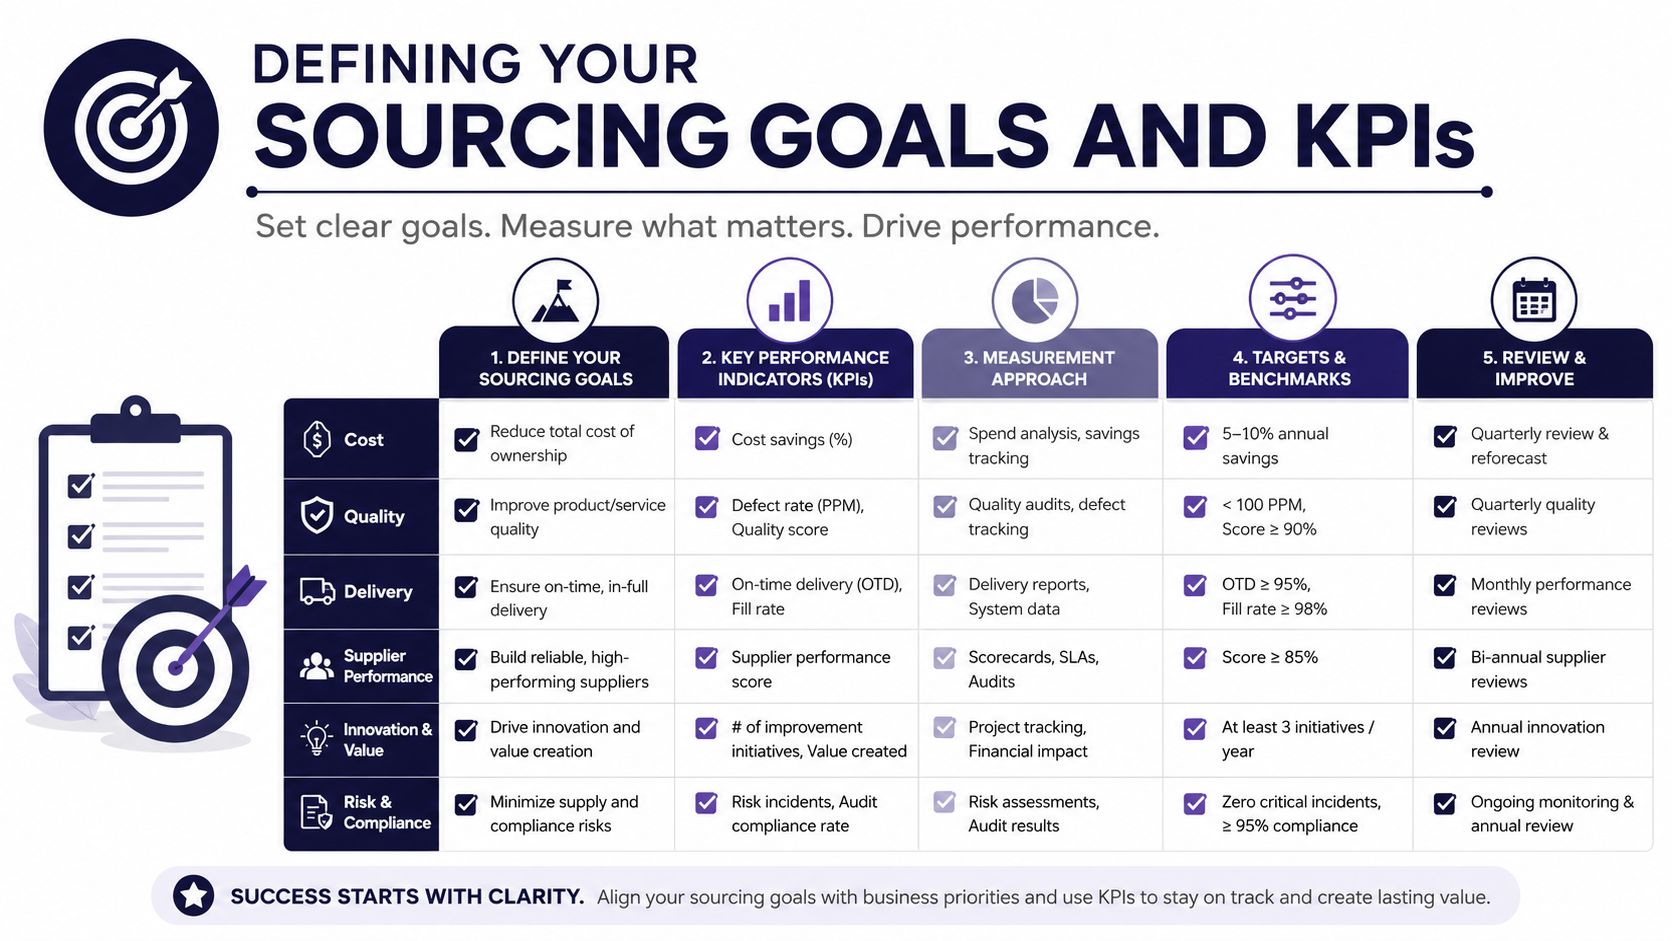
A forecast is useless if you don't know what a good buy looks like for you. A $40 profit item might be great for one seller and a waste of time for another. Before you scan anything, set your sourcing goals in numbers you can defend.
Start with the number that matters most
For a lot of flippers, that number is minimum net profit. If your floor is $15 after fees and shipping, then anything below that is a pass unless it's a fast-turn, low-effort item that fits your strategy. If you're a volume seller, you might accept thinner margins. If you're a part-time picker, your time is tighter, so your floor should be higher.
Your next KPI is sell-through rate. A vintage clothing seller might target a 60% sell-through rate before buying more from that category. That keeps you from building a rack full of “maybe” inventory that only looks good on paper.
Use thresholds that fit your model
A simple framework helps:
- Volume flipper: focus on turnover, low cost of goods, and fast cash recycling.
- High-margin picker: accept slower turns if net profit stays strong.
- Part-time side hustler: protect time first, then profit.
Practical rule: if your sourcing trip ends with a pile of items that are technically profitable but too slow, your KPI is wrong.
Vanity metrics like total listings don't help you in the aisle. Days to sell, net profit per item, and return on sourcing time do. If an item needs perfect timing, perfect photography, and a perfect buyer, it's not reliable inventory. It's a future headache.
For a deeper way to think about those numbers, see this breakdown of sourcing performance metrics. Keep your personal targets written down, because the fastest way to overspend is to improvise every time you find something shiny.
Gathering and Cleaning Sold Comps and Velocity Data
A shelf full of promising inventory can fool you fast. Sold comps cut through that noise. Listing prices show what sellers hope to get. Sold prices show what buyers paid, and that is the number that should guide a buy decision.
Pull the right comps, then strip out the noise
Start with the marketplaces where your category sells. For clothing, that often means eBay, Poshmark, Mercari, and Depop. For books and media, eBay carries more weight, but the rule stays the same. Focus on recent sold prices, because a stale asking price that has sat for months does not tell you much about current demand.
One clean sale can still mislead you. A $500 jacket sale means very little if ten similar jackets closed around $40. Outliers happen, and they can make a weak item look better than it is.
Use a quick filter before you trust any comp.
| Data Issue | Example | How to Handle |
|---|---|---|
| Outlier sold price | One jacket sold for $500, ten similar ones sold for $40 | Ignore the outlier unless the condition or size is clearly different |
| Condition mismatch | New with tags vs. stained, worn, or missing pieces | Match only comparable condition grades |
| Auction distortion | A low-start auction closes below normal market value | Separate auction results from fixed-price behavior |
| Seasonal skew | Winter coat comps from summer | Check recent season-appropriate comps first |
| Thin comp set | Only two sold results in 90 days | Treat the category as uncertain and pass unless margin is huge |
The cleaner the comp set, the less guessing you do at the source. Match condition carefully, compare like with like, and be strict about whether the item is comparable.
Velocity matters more than hype
Velocity tells you how many units moved in the last 30, 60, or 90 days. A category can have a strong sold price and still be a poor buy if the item only moves once in a while. Cash tied up in slow inventory costs you more than a low-effort sale that clears quickly.
I look for repetition first. If the same comp shows up again and again at similar prices, that is usable data. If the results are scattered, old, or messy on condition, the forecast is shaky and the buy should get more scrutiny.
That approach fits market value research for resellers, because market value depends on both price and confidence. A tight comp set gives you more confidence in the buy. A thin comp set usually means you are looking at a slow mover with a good story.
Applying Simple Quantitative Methods in the Aisle
You do not need a complicated model to make better buys at a garage sale. You need a few clean methods you can apply fast, on your phone, while someone's asking whether you want to make an offer.
Moving average beats one hot comp
A moving average smooths out the weird sale that looks exciting but doesn't mean much. If the last few sold prices for a pair of jeans cluster around one band, that's more useful than the single high sale from a rare size or perfect condition pair. I'd rather trust a stable middle than chase a spike.
A 30-day average helps with current pricing pressure. A 90-day average helps you see whether the item is really holding value or just having a short burst. If those two numbers are far apart, stop and ask why.
If the recent comps are sliding, the item is already telling you to pass.
Seasonality can wreck a good-looking comp
A winter coat sold in July doesn't tell you much if you're sourcing in peak cold weather. The same item can look weak off-season and strong when buyers are actively hunting. That's why the timing of the comp matters as much as the number itself.
Weight recent, season-matched sales more heavily. If you're seeing a summer dip in a cold-weather item, don't panic. If you're seeing weak results in the right season, that's the signal.
Sell-through rate keeps you honest
Sell-through rate is the cleanest reality check. Divide sold listings by active listings and you get a rough picture of how often the market is absorbing the item. If an item has a strong sold price but almost no turnover, it may still be a bad buy.
For example, if a pair of vintage Levi's has a 72% sell-through rate and a $45 median sold price, a $12 buy price can make sense after fees and shipping. That's the kind of math that keeps you moving in the aisle instead of arguing with yourself. The item doesn't need to be amazing, it just needs to fit the thresholds you set.
Practical rule: high sold price with low velocity is not demand, it's noise.
Setting Buy and Pass Thresholds with ScanFlip AI
Decision rules save more money than extra research. If your floor is too loose, you buy junk. If it's too strict, you walk away from good flips. The goal is to make the call fast and consistent.
Turn your forecast into a hard rule
A simple buy rule can look like this, minimum net profit, maximum buy price, and minimum sell-through rate. If an item doesn't clear all three, pass. That keeps you from getting seduced by a nice comp number that disappears after fees, shipping, and your own time.
A sourcing-phase tool can help. ScanFlip AI scans by AI photo scan with no barcode needed, barcode scan, or text search, then pulls sold comps across eBay, Poshmark, Mercari, Depop, Amazon, Whatnot, ThredUp, Facebook Marketplace, and TikTok Shop. It also shows net profit after fees with a red or green flip-or-pass verdict, which is exactly the kind of guardrail that stops an emotional buy in a crowded aisle.
Let the tool enforce the rule, not replace it
The point isn't to hand over judgment. The point is to keep your judgment from drifting when you're tired, rushed, or surrounded by other pickers. If the app says red, and your threshold says red, you move on.
For items you can't identify by barcode, the photo scan helps. For books, media, and boxed retail, barcode scan is faster. For everything else, text search gives you one more way to confirm the comp before you commit.
See the scan-to-buy workflow if you want the cleanest way to use that process in the aisle. The best part is still boring, though. You set the numbers once, then you stop renegotiating with yourself every time you find a maybe-good item.
Common Forecasting Mistakes That Kill Profit
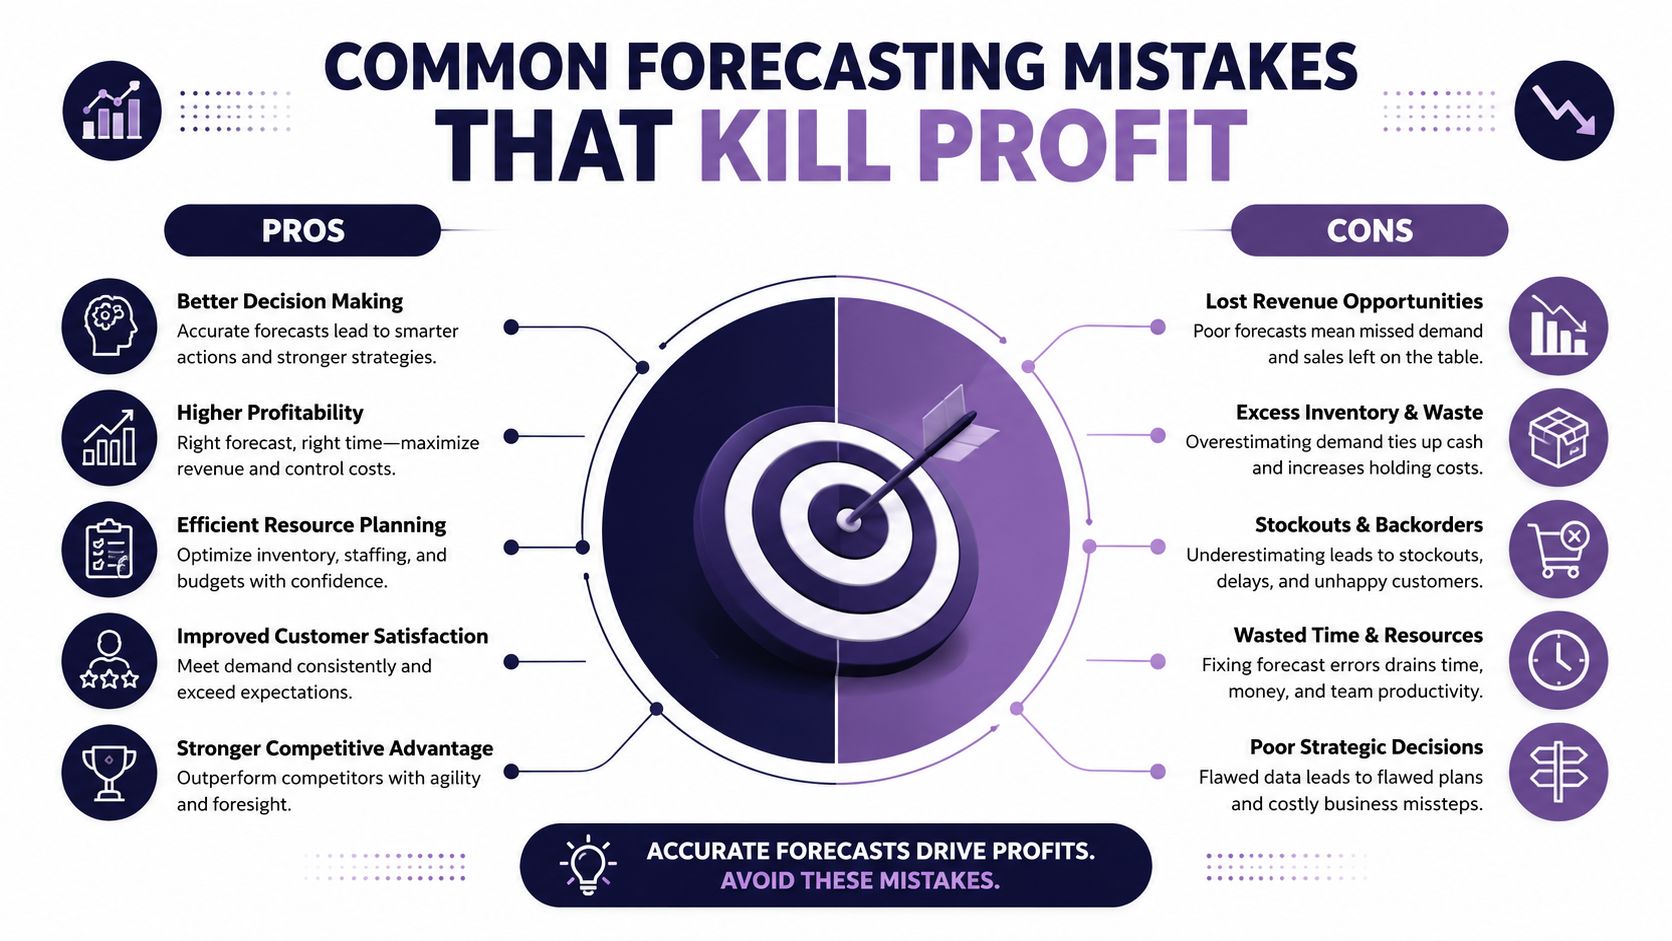
The worst sourcing mistakes usually come from reading the market wrong, not from bad luck. A reseller spots one strong comp, ignores the rest of the range, and buys ten units. A month later the cash is tied up, the listing sits, and the market has already shifted.
The usual traps
- Chasing the top comp: one high sold price can be a fluke, especially if the median is much lower.
- Using asking prices as truth: active listings show what sellers hope to get, not what the market pays.
- Ignoring fees and shipping: gross sales feel good, net profit pays you.
- Buying hype with no turnover: strong sold prices do nothing if the item barely sells.
- Holding seasonal stock too long: by the time you list it, the window may have closed.
A reseller who buys ten units of a trending item at $20 each because they saw a $60 comp can still lose if sell-through is weak. That money sits in storage while better inventory gets passed over. The hard lesson is simple. An item can look expensive, feel popular, and still be a poor buy.
Print this checklist, save it, or screenshot it before your next sourcing trip. Check whether the comp is median-based, whether sell-through looks real, whether fees have been counted, and whether the season fits. If any answer is shaky, passing protects cash.
If you want a faster way to make those buy-or-pass calls in the aisle, use ScanFlip AI to check sold comps, net profit, and demand signals before you spend. It is built for the sourcing decision, so you can scan an item, see the red or green verdict, and move on without second-guessing yourself.