

Retail Arbitrage Flipping: The In-Aisle Decision Workflow
Buying a $6 item at Ross and selling it for $42 looks like a $36 profit, but fees and shipping can cut that to about $25. Net profit matters, not the shelf spread. A clearance sticker only tells me what leaves my bank account. It doesn't tell me what stays there after marketplace fees, postage, returns, defects, or a slow sale.
That distinction separates a profitable sourcing trip from another pile of inventory in the death pile. Retail arbitrage flipping still offers plenty of opportunity, but every purchase has to pass the same test: identify the exact item, confirm recent sold comps, calculate the full cost stack, and decide before money changes hands.
Table of Contents
- Why Raw Spread Lies to New Flippers
- Scanning Methods That Cover Real Inventory
- Calculating Real Net Profit After Fees
- Choosing Channels by Adjusted Profit
- Setting Flip-or-Pass Thresholds in the Aisle
- Using Scan History to Find Better Sources
- Practical Next Steps for Consistent Flipping
Why Raw Spread Lies to New Flippers
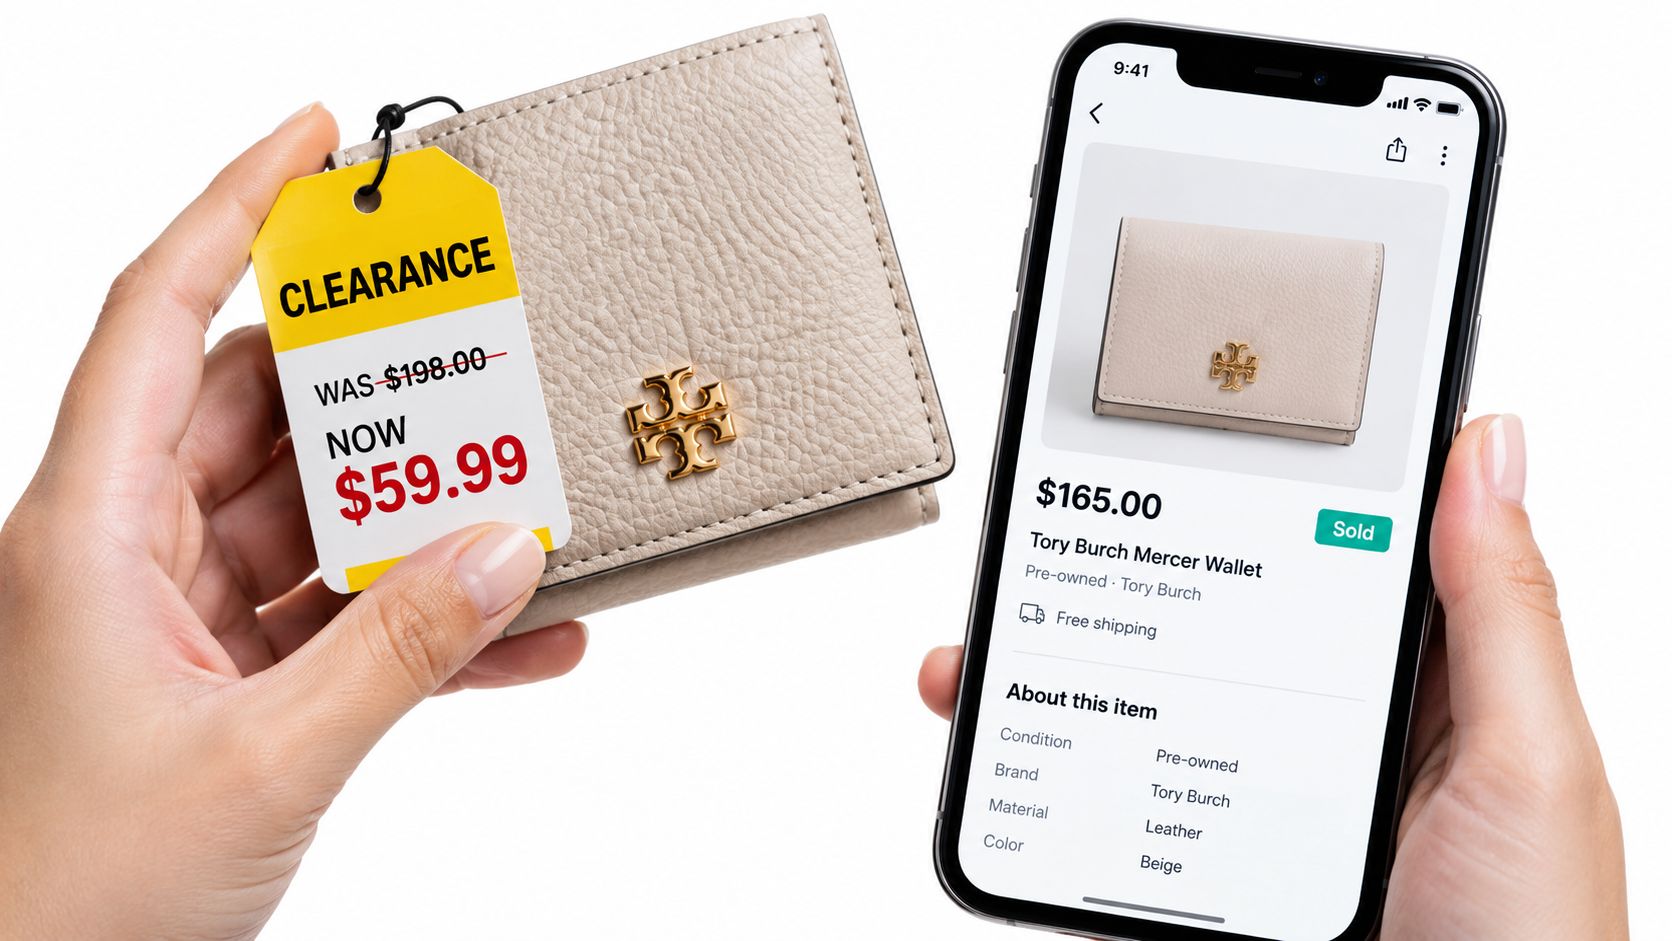
I'm standing at a Ross clearance rack with a branded wallet in one hand and my phone in the other. The shelf says $6. A recent eBay sale shows $42. New sellers see a $36 spread and reach for the cart. Experienced sellers ask what the platform keeps, what shipping costs, and whether the item has enough demand to sell without a long wait.
On eBay, the final value fee is calculated from the total sale amount, which can include the item price, buyer-paid shipping, sales tax, and other applicable charges. For orders above $10, eBay also charges a $0.40 per-order fee, while the percentage varies by category from 2.5% to 15.3%, according to eBay's current selling fee information.
Using the specific example, the buyer pays $42 for the item and $5 for shipping. In a category with a 13.25% fee, the fee base is $47, producing $6.23 in fees, plus the $0.40 order fee. Subtract $4.50 shipping and the $6 cost of goods, and the estimated net is $24.87, not the $36 gross spread suggested by the shelf tag and sold comp.
That difference isn't an accounting technicality. It determines whether I buy one wallet, buy several, or leave every unit behind.
The shelf test
Before buying, I write the calculation in this order:
- Expected sale price: Use recent sold prices for the same model, size, color, condition, and included accessories.
- Selling costs: Add the marketplace fee, order fee where applicable, shipping, packaging, and any expected handling expense.
- Cost of goods: Use the actual purchase price, not a hoped-for clearance markdown.
- Decision amount: Compare the remaining net profit with my minimum threshold and the time required to list and ship.
Active listings can sit unsold for months. Sold comps show what buyers paid, which is why the difference between margin and markup matters at the rack.
The resale economy is much larger than occasional thrift-store luck. The global secondhand apparel market grew 15% in the latest reporting period and represented 9% of worldwide apparel spending, with a projected value of $367 billion by 2029 and an estimated 10% compound annual growth rate, according to the 2025 Resale Report from ThredUp. More buyers create more opportunities, but more sellers also make accurate identification and disciplined math essential.
Practical rule: A large spread is a reason to investigate, not a reason to buy.
Scanning Methods That Cover Real Inventory
A barcode is useful when the item has one. It isn't a complete sourcing strategy.
Books, boxed games, media, sealed retail goods, and many electronics are fast barcode scans. The code can identify the exact edition, pack count, or model, which helps prevent a common mistake: comparing a single item with a multipack or an older version.
Match the scan to the inventory
Use barcode scanning first for:
- Books and media: Confirm the ISBN, edition, and format.
- Boxed retail goods: Check the exact UPC, pack count, and variation.
- Sealed games and electronics: Match the model rather than relying on a similar product photo.
Untagged inventory needs a different approach. In a Goodwill aisle, a vintage jacket may have no readable barcode. At a garage sale, a pair of older sneakers might be separated from its box. Collectibles, toys, cards, and worn electronics often depend on visual details that a barcode-only app can't access.
AI photo identification handles those situations. The camera can identify apparel, shoes, vintage pieces, collectibles, and electronics without a UPC or visible barcode. Good photos still matter. Shoot the front, label, model marking, and distinctive details when the first image doesn't produce a confident match.
Text search is the fallback I use when the item can't be photographed cleanly. Damaged packaging, poor lighting, reflective surfaces, and tiny model numbers can make a photo unreliable. Type the brand, model, size, edition, or identifying phrase instead of forcing a bad scan.
Don't confuse recognition with validation
Identification only answers what the item is. It doesn't answer whether the current sold prices justify the buy. I still compare condition, completeness, recent sales, and the channel where the item is most likely to move.
A useful scanning workflow has three passes:
- Identify the exact product.
- Check sold comps across relevant marketplaces.
- Run the expected sale through fees, shipping, and buy cost.
That combination is why a retail arbitrage scanning workflow needs photo, barcode, and text options. Real sourcing rarely gives you a clean UPC every time.
Calculating Real Net Profit After Fees
The sale price is only the top line. The number I care about is what remains after the buyer's order has been fulfilled and every predictable cost has been removed.
The basic formula is:
Net profit = expected sale price − purchase cost − marketplace fee − fulfillment or shipping − inbound shipping − storage or handling − expected returns and defects.
Then calculate ROI = net profit ÷ purchase cost. I use the expected sale price, not the highest sold comp, when the range is wide. A conservative estimate keeps an exciting find from becoming an expensive lesson.
eBay example
The Ross wallet demonstrates why fee bases matter. A $42 item with $5 buyer-paid shipping creates a $47 fee base. At 13.25%, the fee is $6.23, followed by the $0.40 order fee, $4.50 shipping, and $6 cost of goods. The result is $24.87 net profit.
That is still a viable flip for many sellers, but it isn't the $36 spread visible at the shelf. A bulky shoe box or fragile electronic item can lose even more of its apparent margin when postage and protective packaging rise.
Poshmark threshold
Poshmark's fee structure changes sharply at $15 in the United States. Sales under $15 incur a flat $2.95 commission, while sales of $15 or more incur a 20% commission, according to Poshmark's FAQ.
A $4 thrifted top sold for $14 leaves $11.05 before other costs, or $7.05 after cost of goods. The same top sold for $15 leaves $12, or $8 after the $4 buy cost. At $42, the 20% commission is $8.40, leaving $33.60, or $29.60 after the $4 cost of goods before optional expenses.
That threshold can change the decision on a Goodwill rack. A low-priced item may technically be profitable but still fail once photography, listing, sharing, storage, and packing time enter the picture.
Amazon is not sale price minus buy cost
Amazon separates referral fees from fulfillment costs. Referral fees vary by category and use a percentage of the total price or a category minimum, whichever is greater, as described in Amazon's seller pricing information.
Amazon's 2026 U.S. fee summary says FBA fees will rise by an average of $0.08 per unit sold, with an average increase of less than 0.5% of an item's selling price. For standard-size products priced from $10 to $50, small-standard fulfillment fees increase by $0.25 per unit, while large-standard fees increase by $0.05 on average.
A $12 buy cost and $39 sale price therefore aren't $27 profit. If referral fees, FBA fulfillment, storage, inbound shipping, and prep total $13.50, the net is $13.50, producing 112.5% ROI on cost. The same item becomes a pass if oversized packaging, an older fee estimate, or slower sell-through adds another $5.
Use a net profit calculation workflow before buying multiples. One profitable unit can be a test. A profitable case requires current numbers.
Choosing Channels by Adjusted Profit
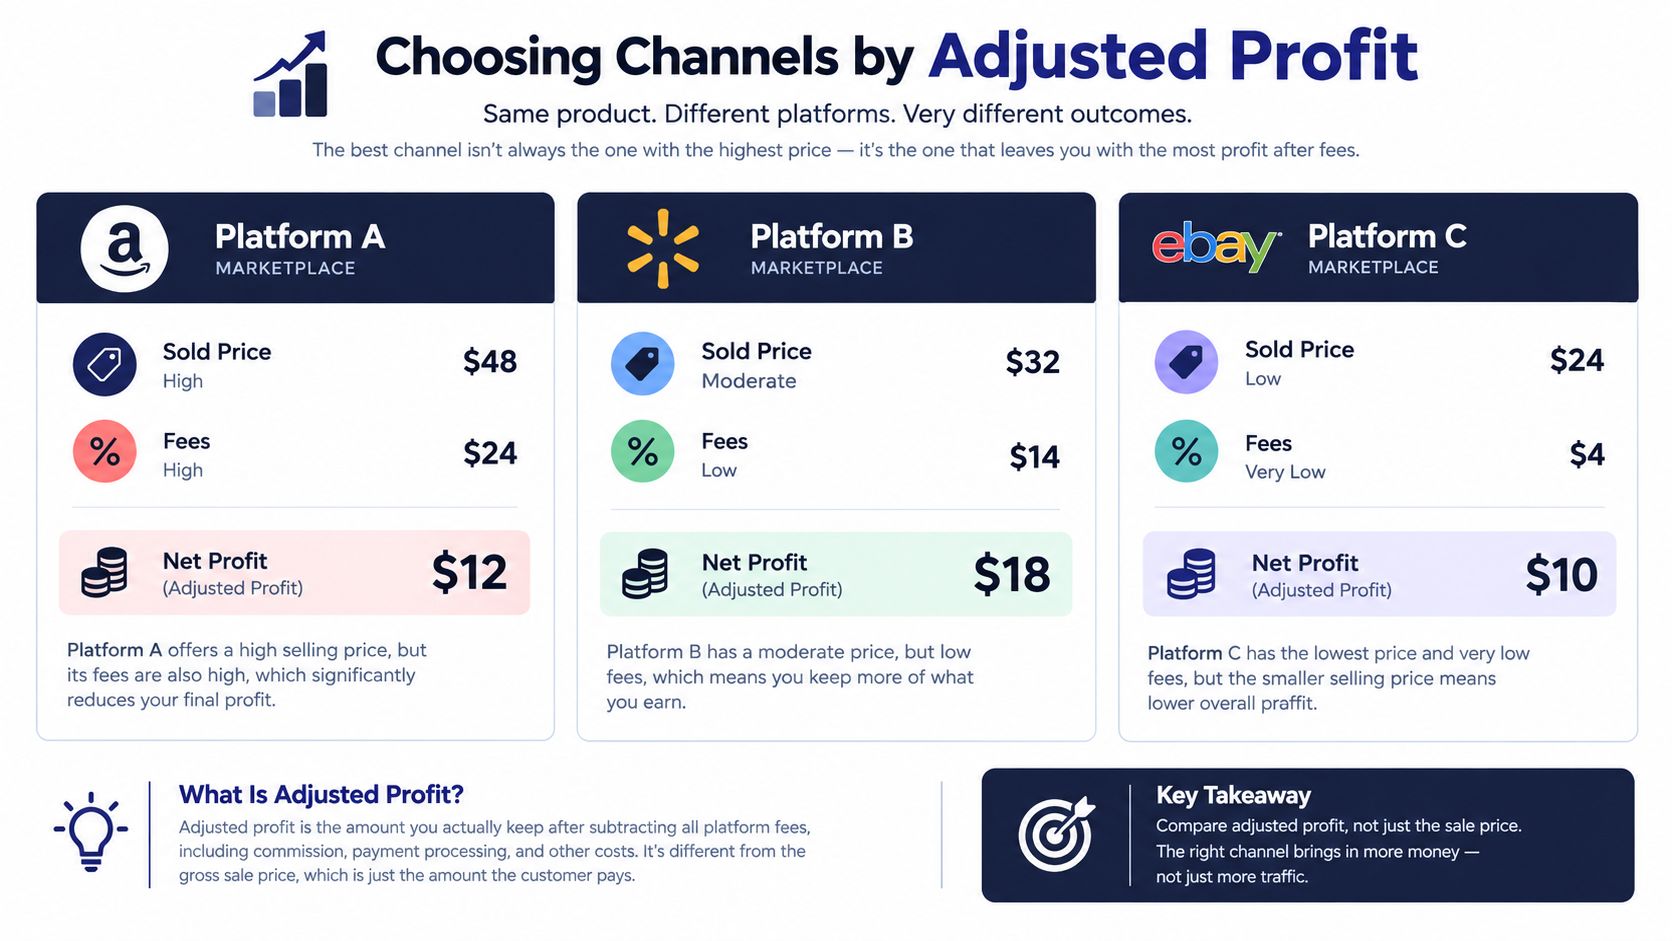
The highest sold price can still produce the weaker flip. Fees, shipping, returns, handling time, and buyer expectations determine what reaches your account. A channel with a lower listing price may leave more cash and create fewer problems.
Resale buyers already use multiple marketplaces. 51% of Gen Z U.S. respondents use three or more resale platforms, compared with 41% of millennials, according to recommerce research reported by Gifts & Decorative Accessories. Apparel makes up only 25% of the U.S. recommerce market, so channel selection changes with the product. A jacket, textbook, collectible, electronics accessory, and home item may each need a different buyer pool.
Compare the whole transaction
Run the same fee-adjusted calculation for every channel:
| Decision factor | What I check |
|---|---|
| Adjusted net profit | Sale price minus platform fees, shipping, cost of goods, and handling |
| Time to cash | Whether the item should sell quickly or require price changes |
| Return exposure | Whether the category creates condition disputes or buyer remorse |
| Condition rules | Authentication, documentation, grading, or category requirements |
| Shipping burden | Weight, dimensions, fragility, packaging, and tracking |
| Buyer fit | Whether shoppers on the platform actively seek the product |
For example, a $42 sale on a channel charging 20% leaves $33.60 before the $4 purchase cost, or $29.60 before other expenses. A different marketplace may produce a lower sale price but a better result after fees and shipping. Use the marketplace fee comparison chart to see how platform deductions change the outcome.
Used clothing often fits Poshmark or Depop because buyers search by brand, style, and size. A boxed retail product may have stronger demand on Amazon, but category eligibility and fulfillment costs must clear the calculation first. A collectible may find its buyer on Whatnot, while eBay's searchable listings can support a steadier sale.
The right question is not where the item sold for the most. Ask where it can produce the best risk-adjusted cash return with the work, fees, shipping process, and selling tools available. If the adjusted profit does not justify those demands, leave the item behind.
Setting Flip-or-Pass Thresholds in the Aisle
A threshold removes the argument between optimism and experience. Without one, every interesting item becomes a special exception. With one, I can make the decision while another picker is reaching for the same shelf.
Set the rule before sourcing. It can be a minimum net profit, a minimum ROI, or both. The number should reflect your time, storage, capital, category knowledge, and tolerance for returns. There's no universal threshold that makes sense for every seller or item.
Build the decision in order
When I pick up an item, I run the same sequence:
- Confirm the exact SKU or model. Include size, condition, color, variation, edition, and pack count.
- Check recent sold comps. Ignore the tempting active price if buyers aren't paying it.
- Estimate the likely sale price. Use a conservative comp when the market is uneven.
- Subtract every known cost. Include fees, shipping, packaging, prep, and the purchase price.
- Apply the threshold. If the result misses the minimum, pass.
- Check restrictions. Verify authenticity, expiration, condition, category eligibility, and completeness.
- Record the decision. A pass is useful data, especially when the same item appears again.
Amazon advises sellers to check selling fees and calculate margins before starting, and it defines retail arbitrage as buying discounted retail goods and reselling them for profit, as outlined in Amazon's retail arbitrage guidance.
Know when a small profit is expensive
A $7 net profit can look positive on paper. It may still be a bad buy if the item needs extensive cleaning, careful photography, a long description, oversized packaging, or repeated price changes.
Low-dollar items also tie up shelf space. If a $4 item sells for $14 on Poshmark, the fee structure leaves $7.05 after cost of goods before other expenses. That can work for a fast, easy garment. It makes less sense for a fragile item that needs testing and special packing.
A clear red or green verdict can speed up the aisle decision, but it shouldn't hide assumptions. I want to know which sold price, fee, shipping estimate, and purchase cost produced the verdict. If any input is wrong, the decision is wrong.
Using Scan History to Find Better Sources
One profitable find tells me almost nothing about a store. A pattern across multiple visits tells me where my sourcing time belongs.
A scan history with photos, locations, and timestamps lets me compare the Goodwill across town with the Goodwill near the warehouse district. It can show that one Ross location produces branded accessories while another mostly produces bulky home goods that fail shipping math. It can also expose a category that looked promising but produced too many returns or too much prep work.

Review wins and misses together
I track more than the items I bought:
- Location: Store, estate sale, garage sale, bin, or clearance aisle.
- Identification: Brand, model, category, and condition.
- Decision: Flip, pass, or uncertain.
- Outcome: Sale price, time to sale, fees, shipping, returns, and final net.
- Reason for failure: Weak demand, wrong comp, damaged condition, restricted category, or excessive shipping.
The failed buys deserve attention. If three electronics purchases from one source required refurbishment, the low shelf prices weren't an advantage. If clothing from a particular thrift store repeatedly sells quickly with low return exposure, that source deserves more time even when individual items don't look spectacular.
Turn records into a sourcing map
Review scan history by location and category, not just by item. Look for repeatable signals:
- Do book scans produce enough net profit after Amazon fulfillment?
- Are Ross accessories easier to ship than shoes?
- Do estate-sale tools need testing that your current schedule can't support?
- Are collectibles worth buying only when condition is complete and authenticated?
This review changes sourcing from random hunting into capital allocation. The best store isn't necessarily the one with the biggest single comp. It's the one that repeatedly produces items you can identify, prepare, list, ship, and sell at an acceptable return.
Practical Next Steps for Consistent Flipping
Start with a small sourcing loop you can repeat. Scan the exact product, verify sold comps, calculate net profit, and apply the same threshold before every purchase. Don't make exceptions because an item feels rare or because another reseller is watching it.
Match the channel to the item and your capacity. A fast-moving, easy-to-ship item may beat a higher-priced product that needs testing, bulky packaging, or constant buyer communication. Record both winners and passes so your next sourcing trip reflects what happened, not what looked promising under store lighting.
Use separate tools for separate jobs. Your listing and crosslisting workflow can remain in Vendoo or List Perfectly, while the sourcing decision stays focused on identification, sold comps, fees, shipping, and ROI. Consistent retail arbitrage flipping comes from repeating a defensible buy process, not from finding one spectacular clearance item.
ScanFlip AI lets resellers identify inventory with an AI photo scan, barcode scan, or text search, then compare sold comps from eBay, Poshmark, Mercari, Depop, Amazon, Whatnot, ThredUp, Facebook Marketplace, and TikTok Shop. It calculates net profit after fees and shipping and returns a red or green flip-or-pass verdict, so visit ScanFlip AI before your next Goodwill run, Ross stop, or garage sale.