
Evidence Based Purchasing for Resellers
You're standing in a Goodwill aisle with one hand on a heavy wool blazer and the other on your phone. The label looks promising, the camel color photographs well, and the $12 price tag feels low enough to make the decision automatic. That's exactly where gut-buying gets expensive.
Evidence based purchasing turns that pause into a sourcing triage system. You check what similar items sold for, account for fees, shipping, packaging, time, and sell-through, then make a blunt flip-or-pass call before money leaves your pocket.
Table of Contents
- The $12 Blazer That Would Have Cost Me $9
- What Evidence Based Purchasing Actually Means at the Bin
- The Four Numbers That Decide a Flip
- A Sourcing Framework You Can Run in 30 Seconds
- Two Real Aisle Scenarios Put Through the Filter
- Why the Highest Sold Comp Is Usually the Wrong Signal
- Collapsing the Framework to One Scan
- Your Aisle-Side Evidence Based Purchasing Checklist
The $12 Blazer That Would Have Cost Me $9
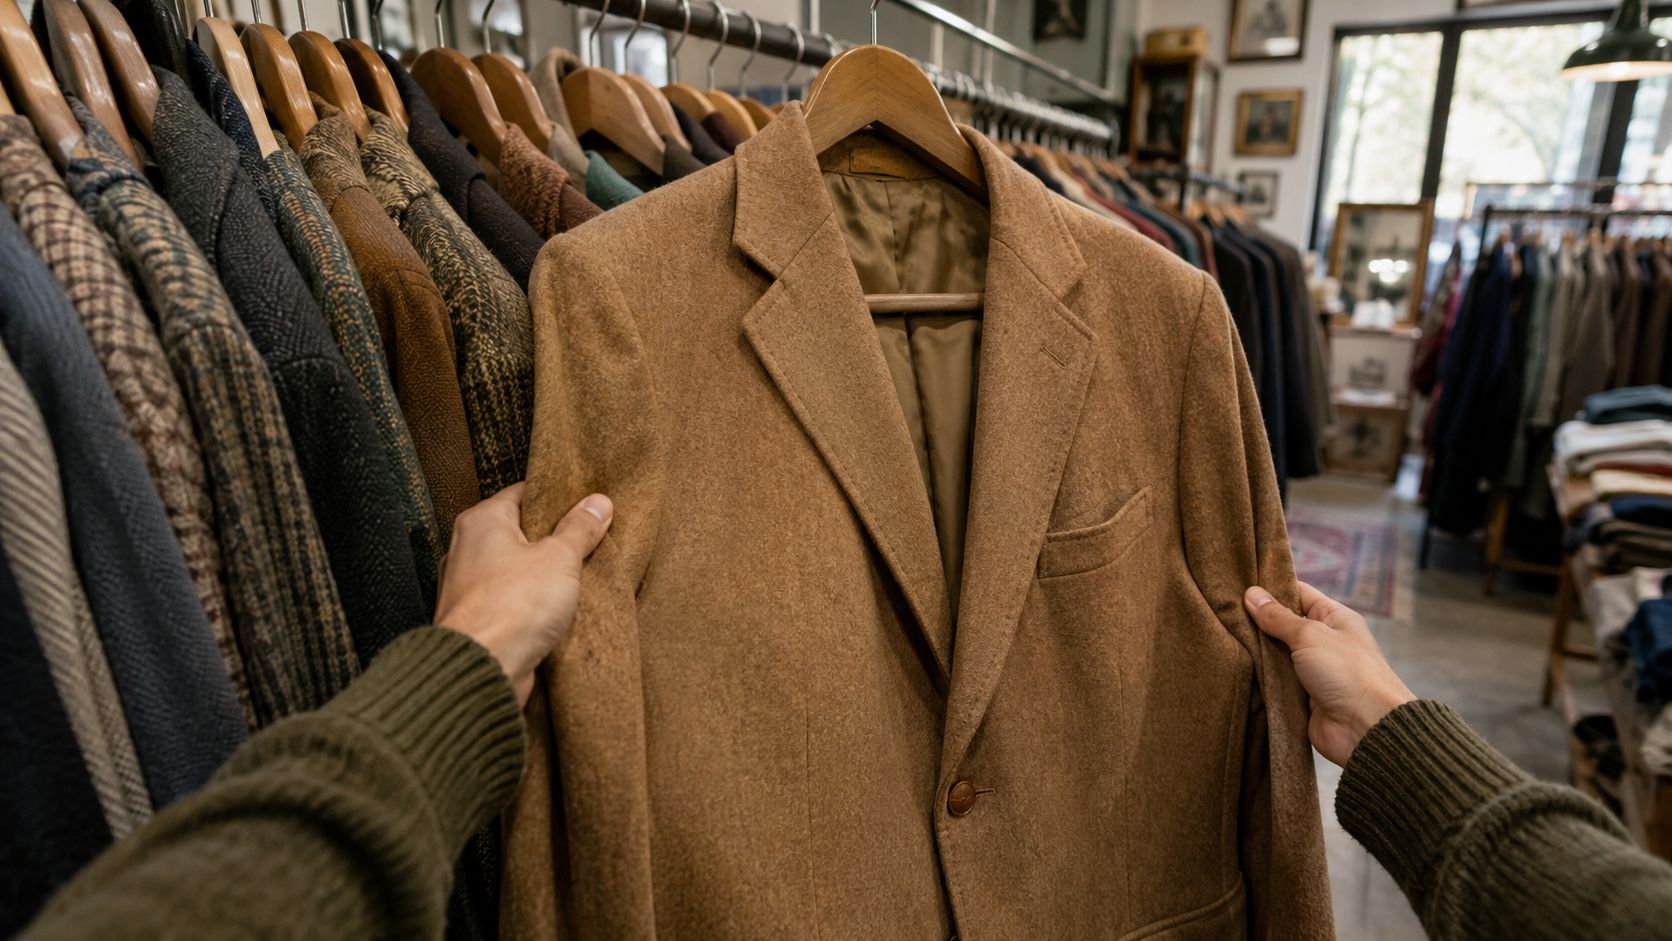
I almost bought a camel wool blazer with leather buttons, single-stitch seams, and soft shoulders. It had the kind of weight and hand feel that makes a thrift-store reseller think, “This has to be something.” The tag said $12, and I was already picturing clean photos and a strong sold comp.
Then I stopped before heading to the register.
The label matched two similar pieces that had closed at around $42 shipped. That looked workable until I checked the details. One took 78 days to sell, and the other accepted a $3 Best Offer discount. Neither comp matched the exact condition, size demand, or likely buyer urgency of the blazer in my hand.
The gross sale price wasn't the only number. After eBay fees, payment processing, the shipping label, a poly mailer, gas, and the time required for a 30-minute listing session, the projected net landed near $9. I would've paid $12 to create a slow-moving item that returned less than its cost of goods.
Practical rule: A piece isn't a deal until the expected net clears your floor.
That blazer looked like a BOLO because the label, fabric, and construction triggered the right instincts. The numbers said otherwise. A promising find can turn into a death-pile resident when the shipping weight is wrong, demand is slow, or buyers negotiate below the median.
The lesson isn't to ignore experience. Experience helps you notice the item. Evidence decides whether you buy it.
What Evidence Based Purchasing Actually Means at the Bin
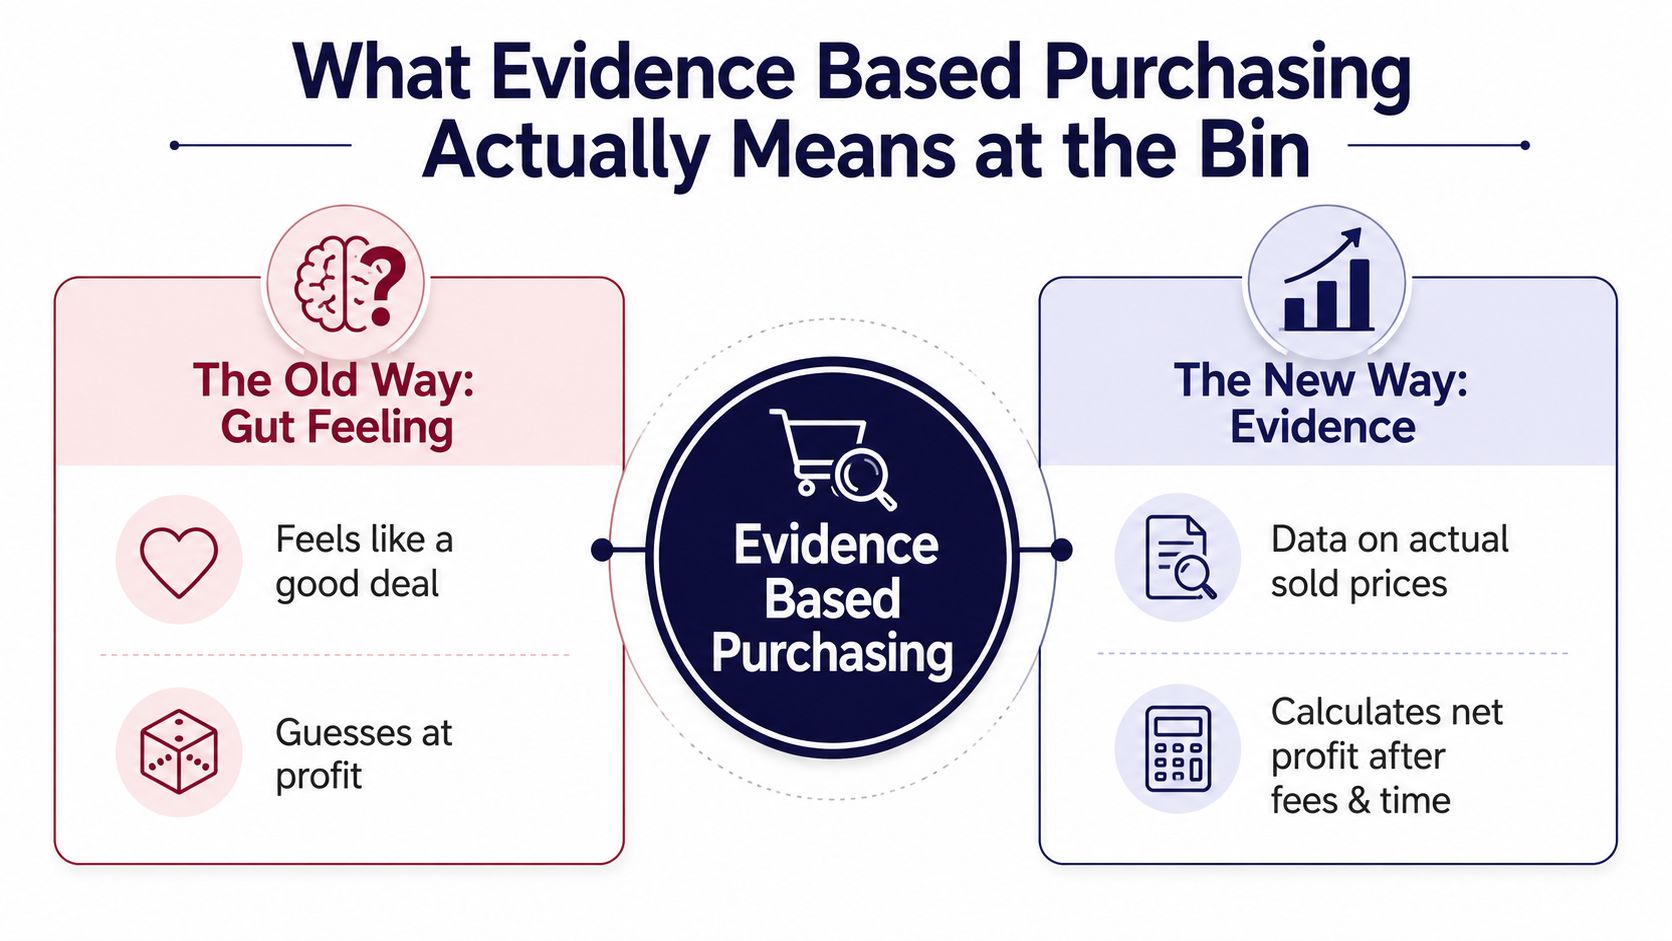
For resellers, evidence based purchasing means making a buy decision from actual sold comps, then adjusting those comps for the costs that determine your take-home. It isn't a theory exercise or a corporate procurement slogan. It's the scan, comp, adjust, decide routine you use while standing at a Goodwill rack, a garage sale table, or an estate-sale basement.
Gut-buying starts with a hunch. A familiar label, attractive color, nostalgic character, or heavy fabric creates confidence before the item gets tested. That approach can work when your category knowledge is unusually strong, but it breaks down when fees, shipping, condition differences, and slow sell-through erase the apparent spread.
Evidence based purchasing uses four inputs:
- Aggregated sold comps: Prices buyers already paid across relevant marketplaces, not asking prices sellers hope to receive.
- Sell-through rate: The relationship between sold items and active competition, used as a practical signal for how quickly demand may convert.
- Fee drag: Marketplace fees, payment charges, shipping, supplies, offers, returns, and other costs that reduce the gross sale.
- Net profit margin: The amount left after cost of goods and operating costs, compared with the minimum return you require.
The filter answers one question quickly: Will this item clear my floor after fees within a reasonable window?
This approach has a longer history than reseller apps. Health-policy literature was already treating evidence-based purchasing as a structural issue in 1997, connecting purchasing decisions with research, financing, and measurable health gain in the NHS market. The broader point applies to flipping: purchasing quality improves when buyers use evidence that's relevant to the decision, rather than information that merely exists. The historical discussion of evidence-based purchasing shows why the concept centers on decision quality and outcomes instead of simple price comparison.
Public procurement illustrates the scale of decisions made this way. The OECD estimated public procurement at about 12% of GDP across OECD countries in 2016, while later research cited city-level procurement volumes of about $6.4 trillion in 2021. The procurement evidence review also notes that evidence about procurement interventions is often mediocre, which reinforces a reseller lesson: data only helps when it's matched carefully to the item and decision.
The Four Numbers That Decide a Flip
A good comp isn't enough. I want four answers before I call an item a buy.
Sold comps
Start with comparable sold prices, not the highest visible result. Match label, model, size, condition, color, completeness, and shipping terms as closely as possible. A median gives you a sturdier working estimate than an outlier, especially when one sale reflects unusual rarity, a bundle, or an exceptional presentation.
For a $4 apparel find with a $28 median sold comp, the gross spread looks attractive. That spread only matters after you remove the costs below it.
Sell-through rate
Sell-through tells you whether demand is active relative to the competition. A category with a sell-through rate under 30% deserves caution because the item may sit for a long time, even when the sold comp looks profitable.
Don't treat sell-through as a guarantee of time-to-cash. It's a filter. Stronger demand can justify a smaller margin, while slow demand needs a larger cushion because your cash stays tied up.
Fee drag
Fees and fulfillment costs are where beginner math usually fails. Stack the marketplace fee, payment processing, promoted listing surcharge if used, shipping label, packaging, and a return reserve. On a $30 sale, that stack commonly runs $7 to $9, depending on the item and selling setup.
eBay's 2026 fee structure for most consumer categories is 13.6% of the total sale amount, plus $0.30 on orders of $10 or less and $0.40 on orders over $10. The fee applies to the item price, shipping, and sales tax, so a gross sold price isn't your take-home. This reseller fee breakdown explains why the full cost stack matters.
Margin floor
Set the floor before you shop. For apparel, my working rule is at least 2x cost net. For media lots, I'll consider 1.5x cost net when the item is compact, easy to ship, and likely to move. If the projected result misses the floor, I skip it.
Here's the clean example:
- Thrift cost: $4
- Median sold comp: $28
- Fees and shipping: $7
- Packaging and gas allocation: $3
- Net after listed costs: $14
- Return: 3.5x cost
That passes because the net clears the cost threshold with room for friction. The opposite example is a $45 comp that accepts a 20% off Best Offer, ships free, and absorbs a return hit. Once those costs land, the projected net falls to $8. That's a pass, regardless of how impressive $45 looked in the sold-results screen.
For a deeper calculation walkthrough, use this guide to calculate net profit.
| Metric | What It Tells You | Pass/Fail Benchmark |
|---|---|---|
| Sold comps | What comparable items actually sold for | Use a realistic median, not an outlier |
| Sell-through rate | How active demand is against competition | Under 30% signals caution |
| Fee drag | How much gross revenue disappears | Subtract every known selling and fulfillment cost |
| Net profit margin | Whether the buy clears your floor | At least 2x cost for apparel, 1.5x for media lots |
Evidence-based purchasing works because these numbers interact. A high comp with poor demand can be worse than a modest comp with clean shipping and steady turnover.
A Sourcing Framework You Can Run in 30 Seconds
The sequence matters. Don't spend time calculating shipping on an item that fails identification, and don't research ten sold comps for an item that can't clear your minimum net.
Scan the item
Identify the exact product first. A barcode may give you a model or edition, but an untagged vintage jacket, shoe, collectible, or electronics item needs image recognition or a text search based on its label and details.
If the identity is uncertain, stop there. A broad category comp for “black leather bag” doesn't validate a specific bag with unknown brand, size, or condition.
Pull aggregated sold comps
Look for close matches across marketplaces. Compare the item you're holding with the items that sold, including condition and shipping expectations. Ignore an attractive result if the sold item is a rare variant, complete set, larger bundle, or materially better condition.
Calculate the net
Subtract the buy cost, marketplace fees, shipping, packaging, and a realistic allowance for offers or returns. The calculation should reflect where you'll sell, because the same gross sold price can produce different net value on eBay, Poshmark, Mercari, Depop, Amazon, Whatnot, ThredUp, Facebook Marketplace, or TikTok Shop.
Make the call
The result is binary. Buy when the net clears your floor and the demand is acceptable. Pass when the comp is weak, the sell-through is stale, the item is expensive to ship, or the projected margin depends on receiving the highest possible offer.
A $6 Lululemon belt bag with a 78% sell-through rate, a $28 median sold comp, and roughly $22 net after fees clears the filter. The point isn't that every belt bag works. The point is that the sequence gets you from identification to a decision without bouncing between multiple apps.
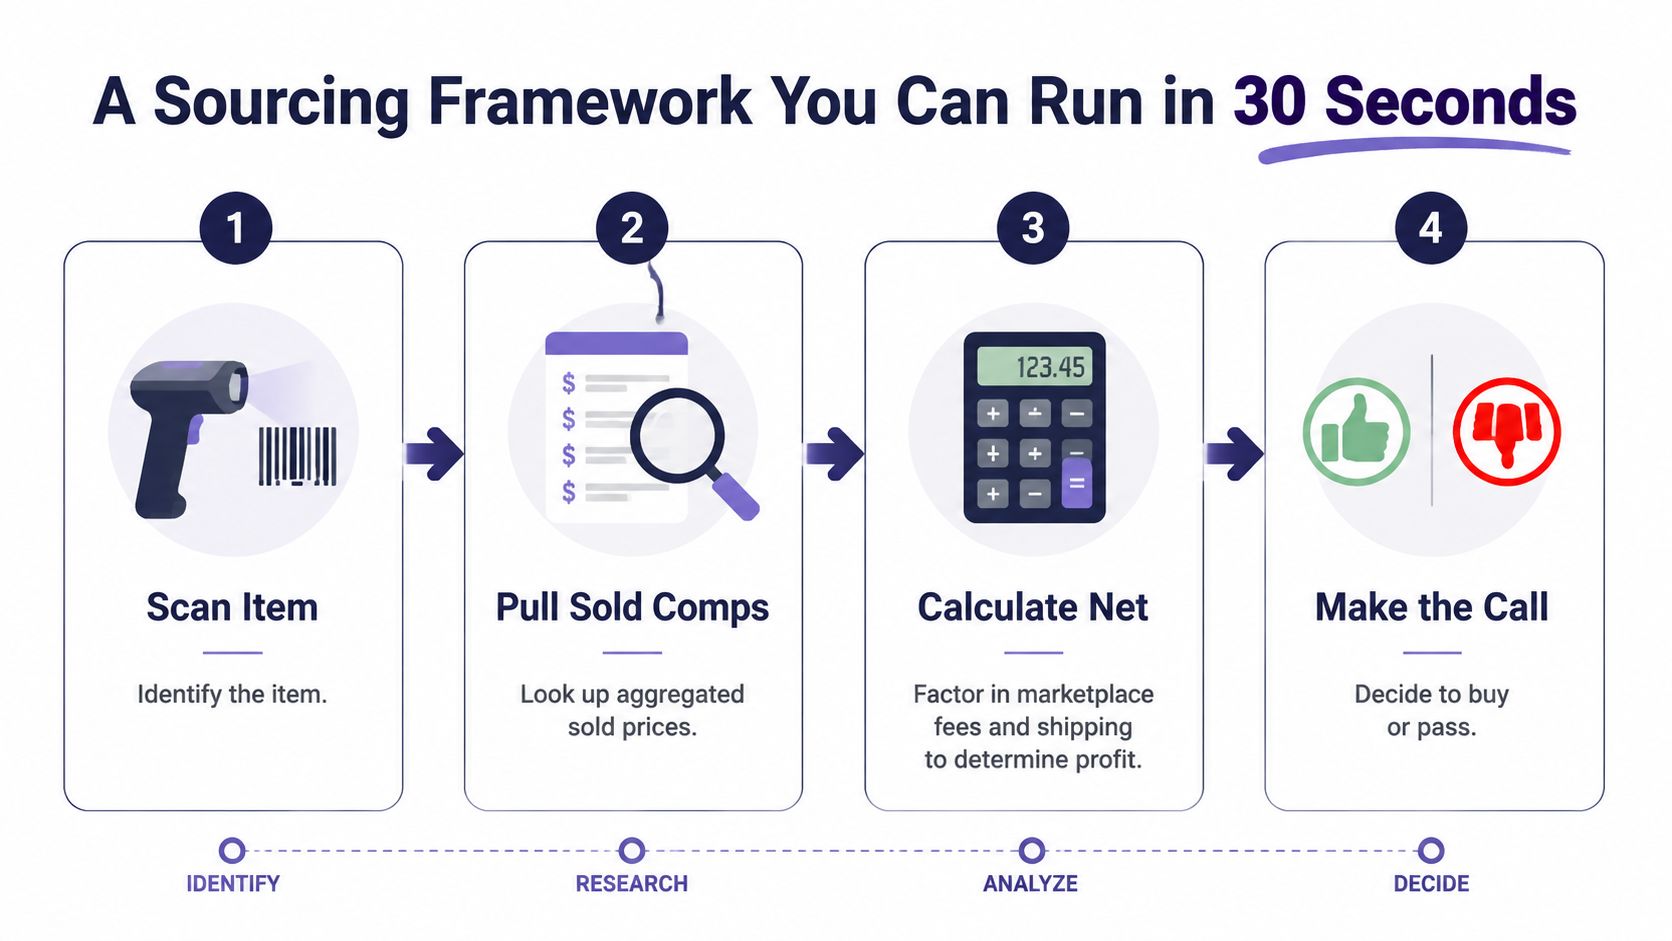
The scan doesn't replace judgment. It puts judgment on top of verified sale evidence instead of wishful thinking.
Two Real Aisle Scenarios Put Through the Filter
Two items can sit beside each other on the same rack and deserve opposite decisions.
The first is a $4 vintage wool blazer. Its median sold comp is $42, but it weighs 6 pounds before packing. The sell-through rate is around 38%, which means the item may sit while tying up cash and storage space. Once marketplace fees, a large shipping label, packaging, gas, and the risk of an offer are included, the apparent spread gets thin.
That blazer might sell eventually. “Eventually” isn't a sourcing metric, and a slow item needs a stronger margin than this one provides. I'd pass unless the condition, label, or construction gives it a clear reason to outperform the matched comps.
The second is a $3 sealed DVD lot of 25 discs. Its median sold comp is $48, sell-through is 92%, and the lot qualifies for flat-rate shipping. After fees, shipping, packaging, and the buy cost, the projected net is roughly $38. That's a cleaner flip because the item is inexpensive, compact, sealed, and supported by active demand.
| Metric | Scenario A: $4 Vintage Blazer | Scenario B: $3 DVD Lot |
|---|---|---|
| Median sold comp | $42 | $48 |
| Buy cost | $4 | $3 |
| Shipping profile | 6-pound shipment | Flat-rate eligible |
| Sell-through rate | Around 38% | 92% |
| Decision | Pass | Flip |
| Projected net | Too thin after costs and time | Roughly $38 |
The comparison exposes a common sourcing mistake. Resellers often focus on the higher-quality-looking item, but evidence based purchasing favors the item with the stronger relationship between demand, cost, shipping, and net profit.
Healthcare purchasing research makes a similar operational point. A systematic review of value-based purchasing programs found that higher-intensity programs were more often associated with desired quality processes, utilization improvements, and spending reductions than lower-intensity programs. For resellers, the translation is simple: a metric must be connected to a decision and a consequence, or it becomes paperwork instead of a useful buying signal.
Why the Highest Sold Comp Is Usually the Wrong Signal
The highest sold comp is often an outlier wearing a disguise. It may reflect exceptional condition, a rare color, a complete bundle, an unusual size, or a buyer who needed that exact item immediately. Your thrift-store find usually won't match all of those conditions.
A top comp can still help you understand the ceiling. It shouldn't set your expected sale price.
Use the median of recent aggregated sold comps, then subtract fees, shipping, supplies, and a risk buffer. The result should clear your margin floor without relying on the buyer who pays the most or accepts the fewest objections.
A lower comp can be the better buy
Suppose one item shows a top sold comp of $120, but the realistic net after the actual cost stack is only $19. A peer item shows a top comp of $42 and produces $26 net after the same kind of adjustment. The lower headline price gives the better flip because it leaves more money after the transaction is complete.
That's the number worth recording in your sourcing notes. Gross price attracts attention. Net profit pays for inventory, gas, supplies, and the next buying trip.
Sourcing rule: The best comp is the one that resembles the item in your hand and survives the full cost calculation.
The same discipline applies to offers. If comparable sellers routinely accept less than their initial price, model the likely accepted price instead of the optimistic one. If buyers expect free shipping, include the label before you decide. If the item needs testing, cleaning, steaming, or repair, account for that labor as a risk even when you don't assign it a formal hourly rate.
Use recent sold prices to build the comp set, but don't stop at the first impressive result. Evidence based purchasing is designed to prevent anchoring.
A hospital value-based purchasing study reached a cautionary conclusion from a different field. Mortality declined over time in participating and nonparticipating hospitals, while the difference-in-differences estimate was −0.03 percentage points per quarter, with a 95% confidence interval of −0.08 to 0.13 and P=0.35, so the difference wasn't statistically significant. The hospital value-based purchasing analysis reinforces the reseller lesson: a measured signal can fail when the incentive and measurement design don't connect to the intended outcome.
Collapsing the Framework to One Scan
The fastest sourcing workflow combines identification, sold comps, cost adjustments, and the decision rule in one result.
For a vintage Polaroid camera, the scan returns a 90-day median sold price of $42, a 25% sell-through rate, and $24 net after fees on a $5 bin price. That earns a thumbs-up because the expected net clears the buy cost and the item has a plausible resale market, even though the sell-through calls for patience.
A generic DVD lot produces the opposite signal. Its median sold price is $4, sell-through is 4%, and projected net is $1. That's a pass. A low buy cost doesn't rescue an item with weak demand and almost no net spread.
The three scan methods cover different sourcing situations:
- AI photo scan: Identify untagged vintage clothing, shoes, collectibles, and electronics without a barcode.
- Barcode scan: Check books, media, games, and boxed retail items quickly.
- Text search: Search an item by name when you can't photograph or scan it cleanly.
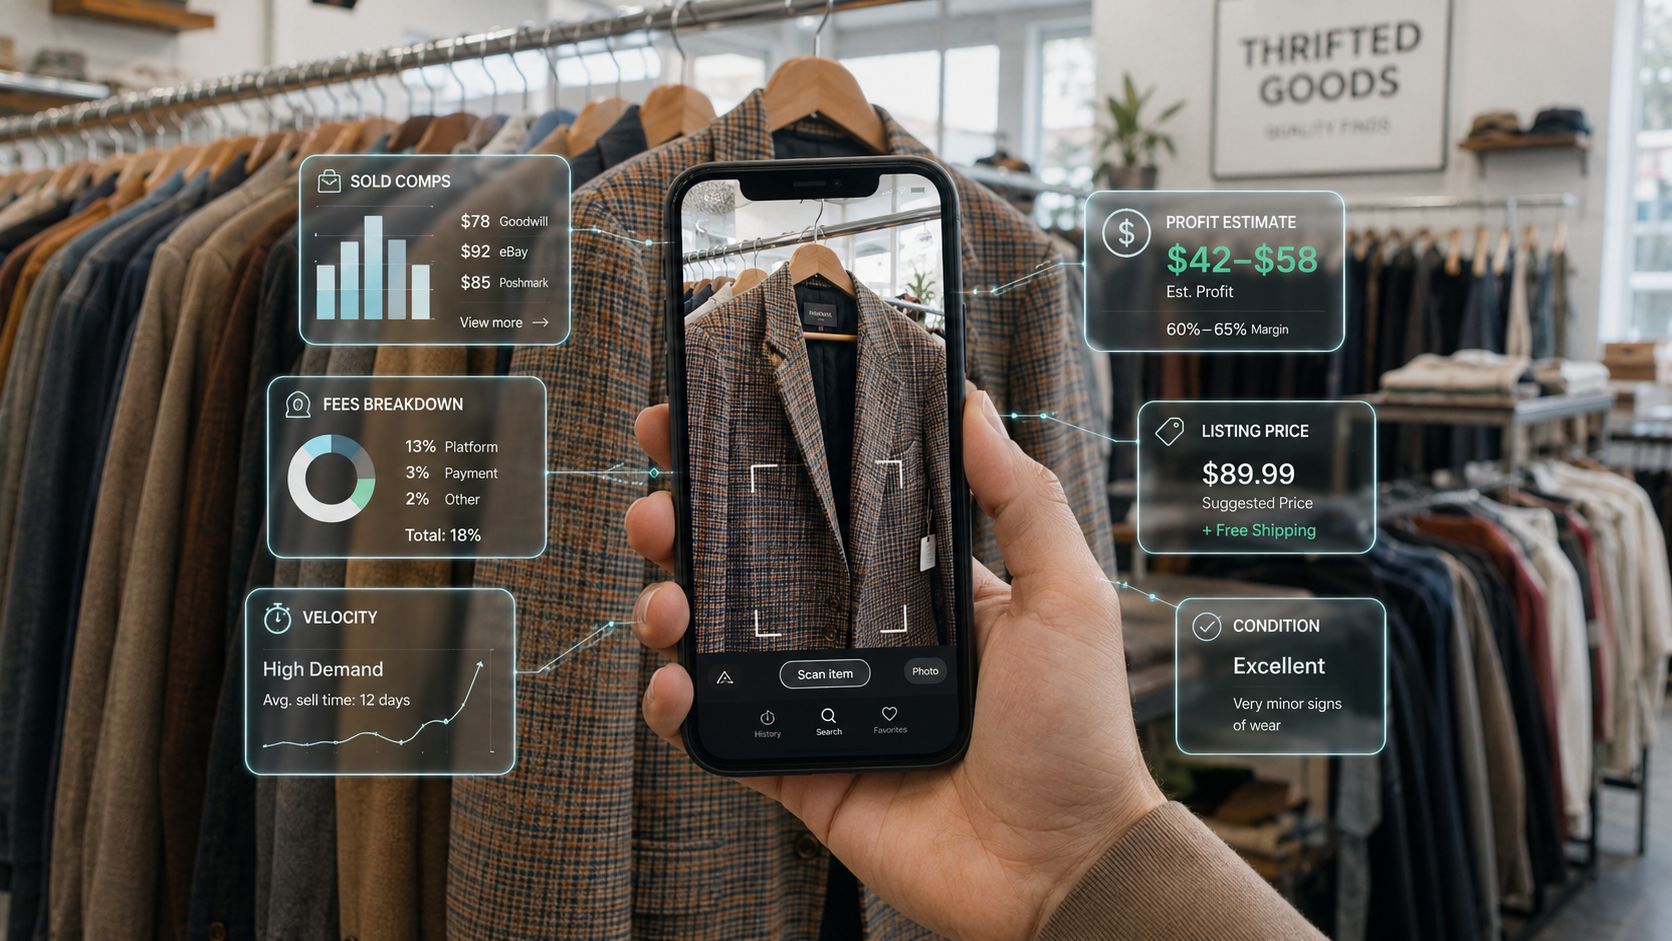
ScanFlip AI's retail arbitrage scanning workflow brings those methods together with aggregated sold comps across eBay, Poshmark, Mercari, Depop, Amazon, Whatnot, ThredUp, Facebook Marketplace, and TikTok Shop. It calculates net profit after marketplace fees and shipping, then returns a red or green flip-or-pass verdict based on the threshold you set.
That doesn't eliminate judgment. You still need to inspect condition, confirm completeness, and reject recalled or unsafe products. It does remove the aisle routine of switching among marketplace apps, sold-result screens, and a separate fee calculator.
Your Aisle-Side Evidence Based Purchasing Checklist
Keep the checklist short enough to use while other pickers are reaching around you. The point is not perfect forecasting. The point is stopping weak buys before they become stale inventory.
- Scan the item. Use the barcode, a photo, or text search to identify the exact model, label, edition, or variant.
- Confirm at least 10 recent sold comps. If the evidence is thin, treat the item as uncertain rather than filling the gap with optimism.
- Check the median, not the highest sold price. Outliers can describe a different item, condition, bundle, or buyer.
- Verify sell-through above 30%. Below that level, demand may be too slow for your cash and storage limits.
- Subtract marketplace fees and shipping. Include packaging, offers, returns, and any other cost that reduces take-home.
- Apply the 3x cost minimum rule. If the expected sale value doesn't give you enough room over cost, pass. For category-specific floors, use the stricter margin rule you've already established.
- Weight for seasonality and time-to-cash. A strong comp doesn't mean much if the item is out of season or likely to sit in your death pile.
- Walk away if any answer fails. Don't let a good label override bad numbers.
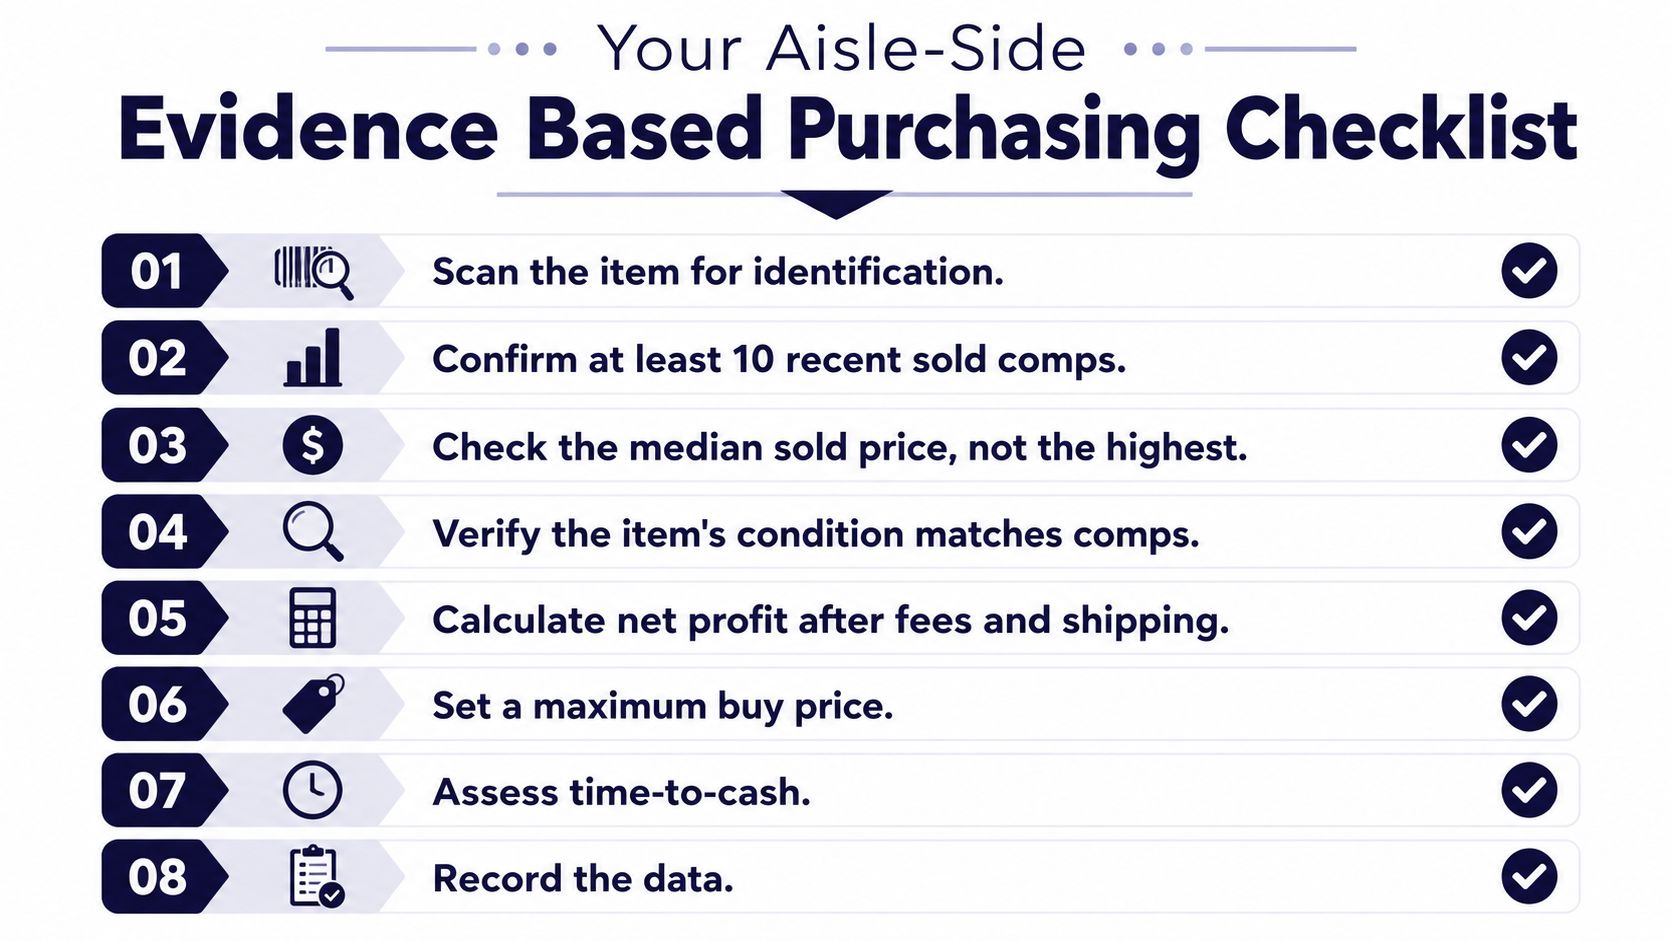
The data also has hard limits. Damage, recalled brands, missing parts, undisclosed odors, and safety concerns override strong sold comps. A profitable calculation can't repair an item that buyers won't trust or that you shouldn't sell.
Print this list, screenshot it, or tape it inside the car door. The checklist is the final guardrail before gut feeling sneaks back into your sourcing routine.
ScanFlip AI gives resellers three ways to check an item before buying, AI photo identification without a barcode, barcode scanning, and text search. It compares sold comps across major marketplaces, subtracts fees and shipping, and returns a red or green flip-or-pass verdict. Use ScanFlip AI on your next thrift, garage-sale, or estate-sale run to turn the aisle decision into a net-profit check.