

Return on Investment Metrics Resellers Actually Use
A $4 lamp in a Goodwill aisle can look like an easy flip when similar sold comps sit near $35. A $25 vintage jacket at an estate sale might show $90 sold prices, while a $120 designer bag in a thrift bin may have sold comps around $300. The rough math happens before the item reaches the cart: sale price minus cost of goods, marketplace fees, shipping, supplies, and the time your cash will sit idle.
That quick calculation is where many flips go wrong. Return on investment metrics aren't just bookkeeping numbers you check after an item sells. Used properly, they form a sourcing decision system that tells you what belongs in the cart, what needs a lower buy price, and what should stay on the shelf.
The same item can show an impressive ROI percentage and still leave you with little money after fees, shipping, returns, repairs, and months in the death pile. This guide focuses on the numbers that hold up in real resale work, including where each metric helps, where it lies, and how to track it consistently across eBay, Poshmark, Mercari, and other marketplaces.
Table of Contents
- The Aisle Moment That Decides Whether a Flip Makes Money
- The Core Return on Investment Metrics Resellers Track
- Worked Example for a Single Item Flip
- Item Level Versus Portfolio Level Analysis
- How to Collect the Inputs Without Fooling Yourself
- Reading Your Scan History Like a Flip Operator
- The Decision Quality Side of Return on Investment
The Aisle Moment That Decides Whether a Flip Makes Money
A lamp priced at $4 sits beside sold comps near $35. The cord works, the condition looks clean, and the item fits your shipping setup. Before it goes in the cart, account for marketplace fees, packing material, shipping risk, and the possibility of a return. The sale price is only an input. The decision rests on what remains after the costs you can reasonably expect.
The $25 vintage jacket may offer more room, with sold comps around $90. It may also require measurements, detailed photos, and a longer wait for the right buyer. Faster sales put cash back into the sourcing loop. A jacket that sits for months competes with other inventory for the same money.
The $120 designer bag carries a different risk profile. A $300 sold comp can lose much of its spread to authentication, platform fees, insurance, returns, or condition disputes. A large gap between buy price and sale price does not make the purchase safe.
Practical rule: Ask three questions before buying: “What will I keep, when will I get it, and what else could this cash buy?”
ROI is calculated as net profit divided by investment cost, multiplied by 100, a standard definition explained by the U.S. Chamber of Commerce. In resale, investment cost should include every known cost tied to the item, not only the shelf price. Fees, shipping, packaging, repairs, discounts, and return losses can change the result.
The sourcing decision happens before the sale, so estimates need a place in your workflow. Record the expected buy price, likely selling costs, and holding risk while the item is still in your hand. For repeated scanning, a tool such as ScanFlip AI can help organize those buy-side inputs before you commit cash, rather than explaining a weak result afterward.
After the sale, replace estimates with actual figures. Compare the expected and realized outcome, then adjust future buy thresholds. Over time, return on investment metrics become a practical sourcing filter, showing which items deserve another purchase and which attractive comps consistently mislead you.
The Core Return on Investment Metrics Resellers Track
Each metric answers a different sourcing question. Track them together before buying, then compare the estimates with the final result after the item sells.
Start with profit, cost, and margin
Absolute net profit = final proceeds minus every cost. It answers the plain-dollar question, “How much did I make?” Include the purchase price, platform fees, shipping, packaging, repairs, discounts, and return losses when they apply. A high percentage return on a cheap accessory can still produce less cash than a lower-return furniture flip.
Gross margin = net profit ÷ final sale price × 100. Margin shows how much of the buyer's payment remains after costs. It helps expose listings where fees and fulfillment consume too much of the sale price, although it does not show how much cash stayed tied up before the sale.
ROI percentage = net profit ÷ total investment cost × 100. Use the full investment cost rather than the thrift-store price alone. A low buy price can look impressive until selling fees, shipping, preparation, and other item-level expenses are included.
Return on capital employed, or ROCE, = operating profit ÷ capital employed. This is mainly a business-level measure. It can help larger operations judge whether money committed to inventory, equipment, and other operating resources is earning enough compared with other uses. It is less useful for making a quick Goodwill decision.
Add speed and demand metrics
Inventory turnover = cost of goods sold ÷ average inventory cost. It estimates how often stock cycles through the business during a period. Faster turnover usually releases cash sooner, but pursuing speed can force thin margins or weaker buys.
Sell-through rate = units sold ÷ units available or listed × 100. Use it to compare categories, sourcing locations, and listing decisions. A strong rate still needs a profit check because fast-selling items may sell too cheaply to justify the work.
Days to sell = total days held for sold items ÷ number of sold items. Count the period consistently across items. If cash availability matters, include the time until payout rather than stopping the clock when a buyer commits.
ROAS = revenue attributed to paid promotion ÷ advertising cost. Use this for promoted listings or other paid advertising. ROAS measures sales tied to advertising, not the money left from the flip. Deduct cost of goods, platform fees, shipping, and other expenses before judging profitability.
| Metric | Formula | What It Tells You |
|---|---|---|
| ROI percentage | Net profit ÷ total investment cost × 100 | Efficiency of the money invested |
| Gross margin | Net profit ÷ sale price × 100 | Portion of sale proceeds retained |
| Net profit | Sale proceeds minus total costs | Dollars left after the flip |
| ROCE | Operating profit ÷ capital employed | Return from broader business capital |
| Inventory turnover | Cost of goods sold ÷ average inventory cost | How quickly stock cycles |
| Sell-through rate | Units sold ÷ units available × 100 | Demand and conversion at item level |
| Days to sell | Total holding days ÷ sold units | Speed of cash recovery |
| ROAS | Attributed revenue ÷ ad cost | Advertising revenue efficiency |
Use the metrics as a sourcing screen, not a post-sale scorecard. ROI shows percentage efficiency, net profit shows available dollars, and turnover shows how quickly capital can return. A reseller sourcing performance framework can keep those measures connected while you evaluate a buy, so one attractive comp does not outweigh slow demand, high costs, or cash tied up too long.
Worked Example for a Single Item Flip
Consider a $35 vintage leather jacket bought at an estate sale. It sells on eBay for $120. The final value fee is $14, the shipping label costs $8, packaging costs $6, and the jacket takes 41 days to sell.
The net profit calculation is:
$120 sale price − $35 buy price − $14 fee − $8 shipping − $6 packaging = $57 net profit
That $57 is the number to use for the main return metrics. The net profit calculation guide for resellers is useful because it keeps the sale price separate from the money left after selling costs.
| Input / Metric | Amount |
|---|---|
| Sale price | $120 |
| Buy price | $35 |
| Final value fee | $14 |
| Shipping label | $8 |
| Packaging | $6 |
| Net profit | $57 |
| ROI | 90% |
| Gross margin | 48% |
| Holding time | 41 days |
| Simple annualized ROI | About 800% |
The 90% ROI comes from $57 divided by the $63 total investment cost, then multiplied by 100. That looks healthy. The 48% gross margin comes from $57 divided by the $120 sale price, so it tells a less dramatic but still solid story.
The dollar view is even clearer. You put $35 into the jacket and receive $57 in profit after the listed selling costs. That cash result may be attractive, especially if the jacket required little preparation and the sale had no return complications.
The annualized view exposes the limitation. A simple annualized ROI calculation takes the 90% item ROI and scales it by 365 divided by 41, producing roughly 800%. That figure is only a mechanical pace estimate, not a promise that you can repeat the exact flip continuously. It also ignores sourcing time, listing time, payout delays, reinvestment friction, and the possibility that the next jacket takes much longer to sell.
The deeper finance point is that timing changes the value of a return. Net present value discounts each cash flow at a hurdle rate or WACC, and a project should be accepted only when NPV is above zero. The NYU Stern overview of NPV and IRR explains why two investments with similar headline returns can rank differently when their cash flows arrive at different times.
For a flipper, the practical lesson is to record both ROI and days to sell. The jacket made good money, but its holding period still matters when comparing it with a smaller flip that returns cash in a week.
Item Level Versus Portfolio Level Analysis
A single sold item can be excellent while the overall operation struggles. Item-level ROI answers, “Was this flip profitable?” Portfolio-level analysis answers, “Is my entire pool of cash working well?”
Take a month in which you sell 25 items, the average item-level ROI is 140%, and cash profit is $1,800. That sounds like a strong month until you include $4,200 tied up in 40 unsold units bought six months ago. Those units may eventually sell, but the capital isn't available for today's estate sale or tomorrow's retail clearance.
The two views side by side
| Metric | Item-Level View | Portfolio-Level View |
|---|---|---|
| Profit | Profit from one sold unit | Total net cash profit across sales |
| ROI | Return on one item's cost | Return on all invested capital |
| Inventory | Usually excludes unsold items | Includes stock still held |
| Sell-through | Whether the item sold | Whether the buying strategy converts |
| Holding time | Days for one item | Age and concentration of the whole inventory |
| Capital efficiency | Profit relative to one buy | Profit relative to cash committed across the operation |
The item-level view might celebrate a rare jacket that returned 140% ROI. The portfolio view asks whether the jacket's result offsets slow books, weak electronics, and stale clothing sitting in storage. It also reveals concentration risk. If most of your cash sits in items with uncertain demand, your sold-item reports can remain cheerful while your available buying budget shrinks.
Inventory turnover adds the missing speed signal. Track cost of goods sold against average inventory cost for the period, then compare that result with your sell-through rate and days to sell. A low-turnover portfolio needs a different sourcing response than a low-margin portfolio. The first needs faster or more selective buys. The second needs better buy prices, lower costs, or a different category.
Capital-adjusted ROI is especially useful for a death pile. Divide total net profit by the full capital committed to sold and unsold inventory, rather than dividing only by the cost of sold goods. This produces a less flattering number, but it reflects the business you operate.
Use item-level ROI to identify what to source again. Use portfolio-level return on investment metrics to decide whether the whole operation is paying you for the cash, storage, and time it consumes. Inventory valuation methods for resellers can help keep unsold stock from disappearing from your performance view.
How to Collect the Inputs Without Fooling Yourself
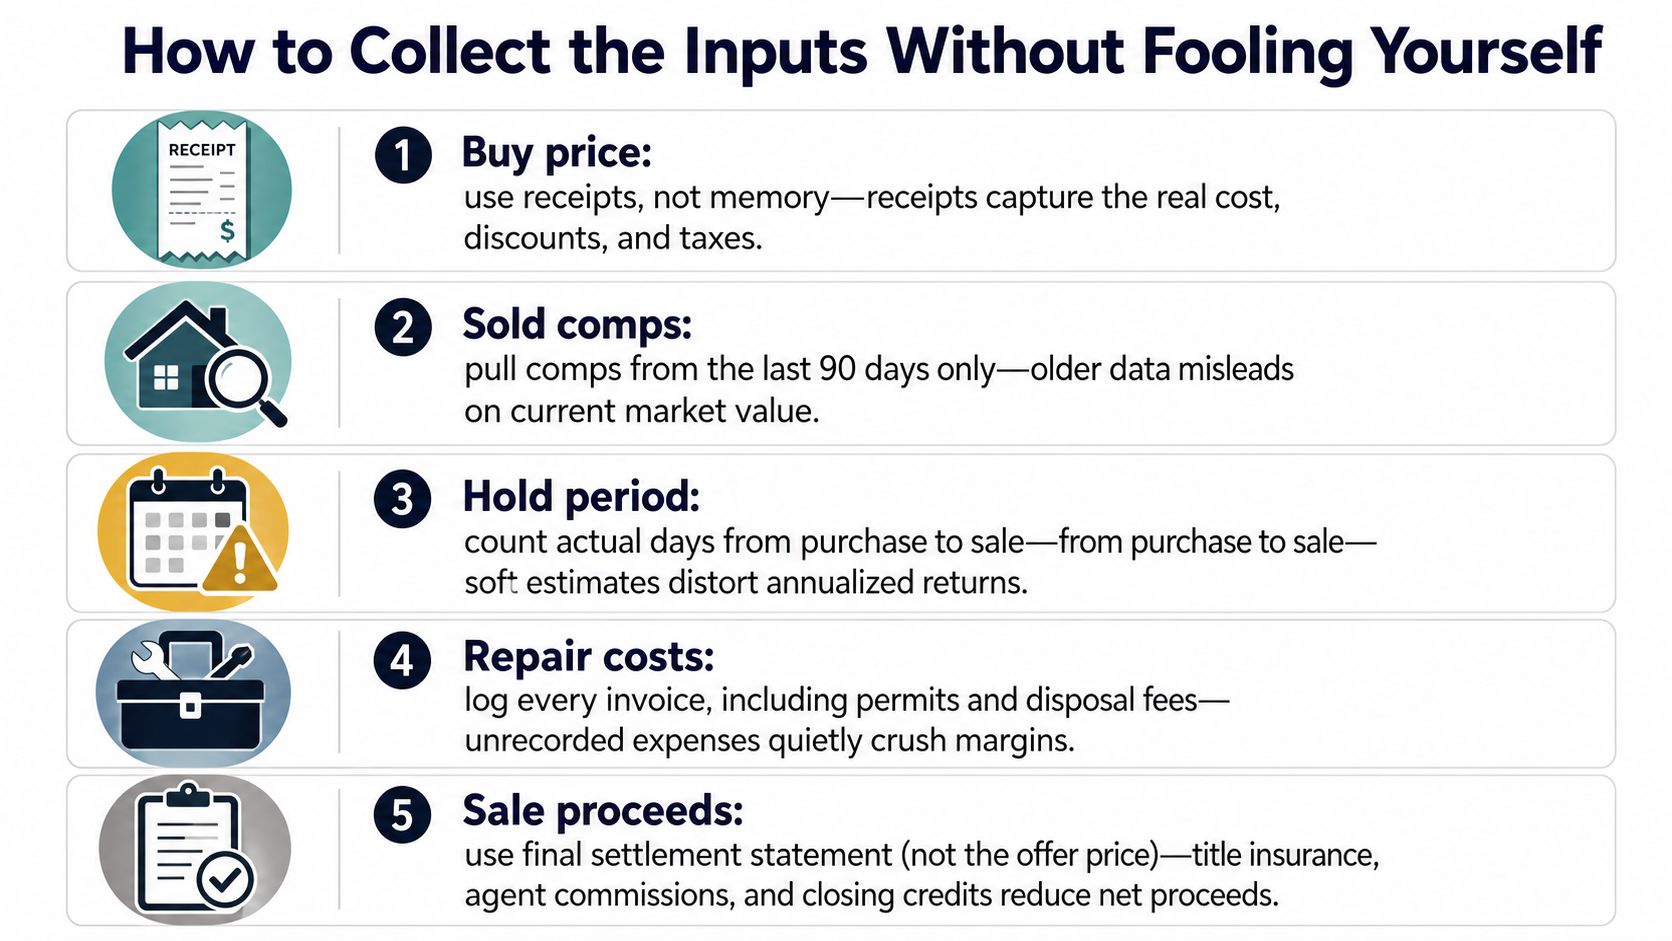
Bad inputs create convincing but useless return on investment metrics. The formula can be correct while the answer is wrong because the buy price came from memory, the sold comp was an outlier, or the shipping estimate ignored the box.
Capture the five inputs that matter
- Buy price: Keep the receipt, estate-sale note, or purchase record. Include discounts and taxes where they belong in your accounting.
- Sold comps: Compare recent sold prices for the same model, size, color, condition, and completeness. Don't use asking prices or one optimistic outlier.
- Platform fees: Check the current fee schedule for the marketplace and category. Include final value fees, payment processing, promoted listing charges, and any other selling deduction.
- Shipping cost: Price the actual carrier service, label, box, padding, and handling materials. Soft goods can become expensive when package dimensions or weight move into a higher rate.
- Holding time: Track purchase date through the point when proceeds are available. List date to sale date is useful for demand analysis, but it doesn't represent the full cash cycle.
For Poshmark, the fee structure changes by sale price. Sales under $15 carry a $2.95 fee, while sales of $15 and above carry a 20% fee, with shipping label cost included in the platform model, according to ResaleOS's marketplace fee breakdown. That tier makes low-ticket flips especially sensitive to buy price and packaging effort.
Catch the quiet margin leaks
Before buying, check whether the sold price is pre-tax or the amount you receive. Add promoted listing surcharges when applicable, and don't assume a one-pound package will ship at the cheapest rate if the box creates dimensional-weight issues.
Returns need their own line in your records. A refund can reverse the sale proceeds and claw back an original fee, while outbound shipping, return shipping, and damaged packaging can remain real costs. Build a return reserve from your own history instead of pretending every sale is final.
Use this quick purchase check:
- Confirm the buy price from the receipt.
- Check multiple relevant sold comps.
- Enter the platform fee for that category.
- Weigh and measure the packed item.
- Decide how long you're willing to hold it.
- Calculate net profit and ROI before paying.
Reading Your Scan History Like a Flip Operator
A scan log becomes useful when it shows patterns in your decisions, not just a list of items you considered. Suppose a month contains 180 scans, 12 listed items, and 9 sold items. The raw totals don't explain much until you separate fast movers such as Lululemon leggings and Bose QC35 headphones from slower items such as a vintage camera or a niche cookbook lot.
The first question is not which item had the highest ROI. Ask which categories consistently survive your buy rules, sell without excessive waiting, and produce enough dollar profit to justify the sourcing and listing work.
Turn scans into category signals
Create a simple review with these columns:
- Category and subcategory
- Scans
- Passed
- Bought
- Listed
- Sold
- Net profit
- ROI
- Days held
- Reason for passing
A category with a pass-through rate above 60% may deserve attention, but don't treat that threshold as proof of profitability. It only tells you how often items met your initial screen. Compare it with actual sold outcomes, net profit, and holding time.
Look for forecast errors too. If estimated ROI repeatedly underpredicts actual ROI by 20 or more percentage points, your assumptions may be too conservative, your sold-comp selection may be improving, or the category may have hidden upside in condition and presentation. If the estimate overpredicts results, inspect fees, shipping, returns, and the difference between average sold prices and the specific items you bought.
Treat rejected items as feedback
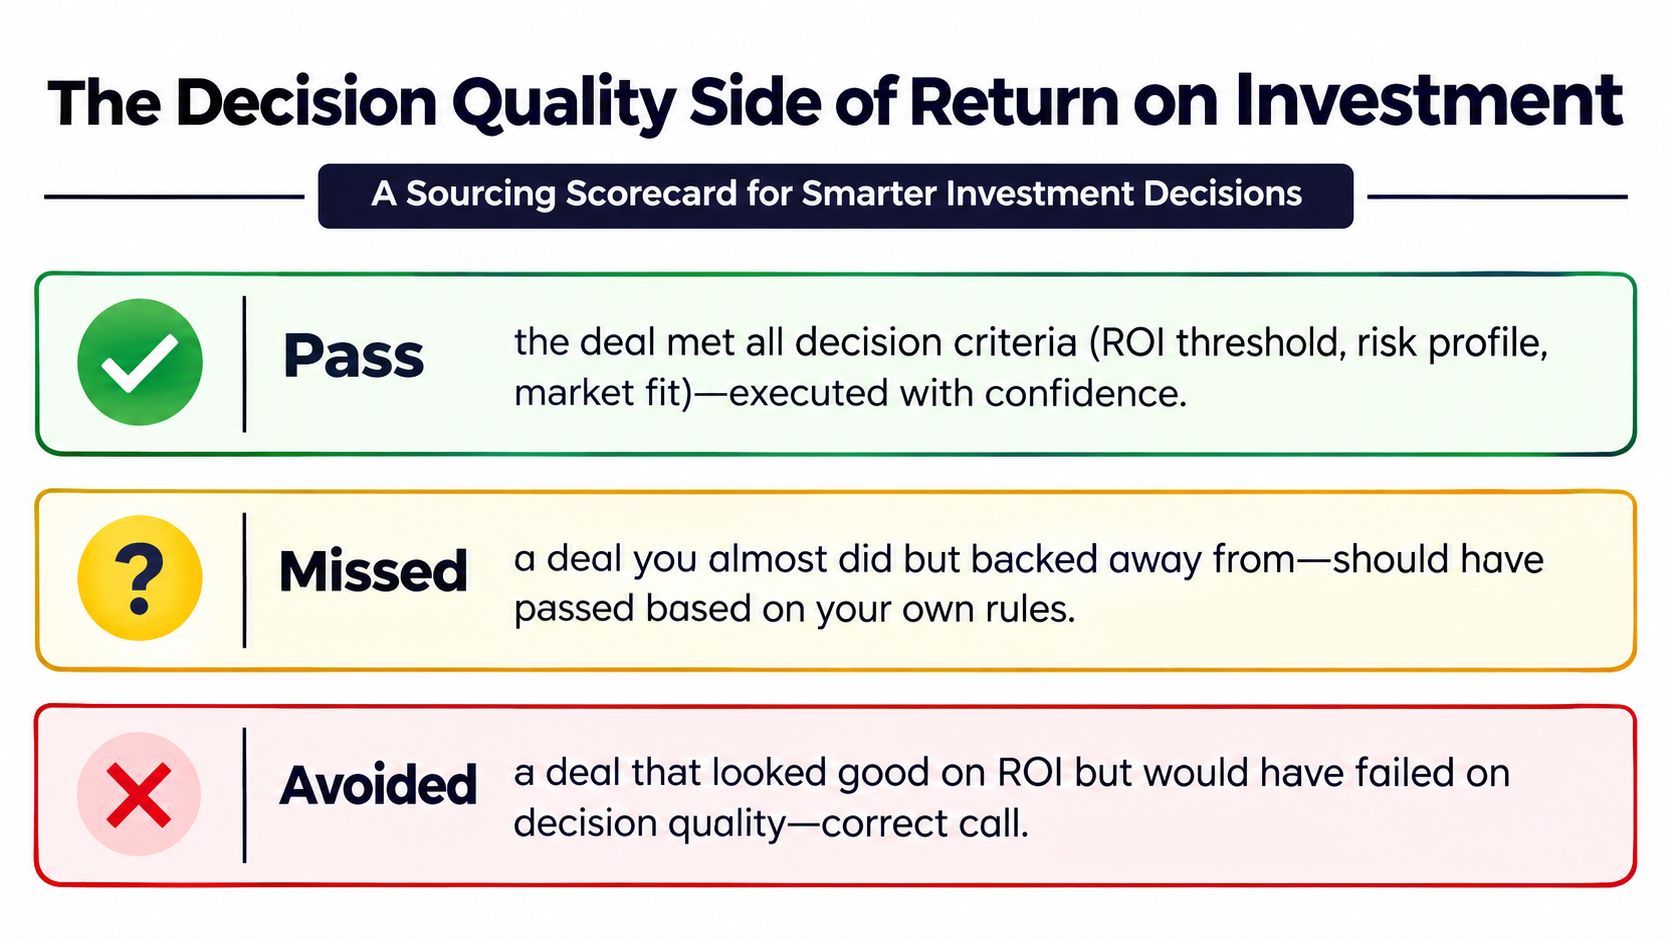
Some items that fail your flip-or-pass threshold will sell anyway. That doesn't automatically mean the threshold was wrong. A rejected item may have sold at an unusually favorable price, required more work than the scan showed, or moved quickly for reasons that won't repeat.
The useful comparison is between the rule and the outcome. Record rejected items, then review whether they would have met your minimum net profit, margin, and holding-time requirements after actual costs. This separates a missed opportunity from a correct pass that happened to find a buyer later.
ScanFlip AI fits this buy-side workflow by offering AI photo identification without a barcode, barcode scanning, and text search, then aggregating sold comps across eBay, Poshmark, Mercari, Depop, Amazon, Whatnot, ThredUp, Facebook Marketplace, and TikTok Shop. Its net profit calculation accounts for fees and shipping, while scan history and a red or green flip-or-pass verdict give you a consistent record to compare against real outcomes.
The scan history should change your sourcing behavior. If Bose headphones sell quickly and niche cookbook lots consume storage, your next trip should reflect that evidence, not a memorable one-off score.
The Decision Quality Side of Return on Investment
ROI tells you what happened after money changed hands. Decision quality measures the quality of the choices made before the purchase, including the items you rejected and the time you saved by refusing weak opportunities.
Three scores make this practical.
Pass rate
Pass rate = scans rejected ÷ total scans. A high pass rate isn't automatically good. It may mean your standards are disciplined, or it may mean your buy rules are too strict for the stores and categories you're visiting.
Track the rate alongside actual purchases, net profit, and sell-through. A flipper who rejects most items but buys a steady stream of sound inventory may be protecting capital. Another flipper with the same pass rate may be scanning the wrong aisle.
Avoided loss
Avoided loss estimates the money you didn't risk by passing on items that looked attractive but failed after full costs. Include the likely buy price, realistic sold comp, fees, shipping, expected holding time, and condition risk. Don't count every passed item as an avoided loss. Some would have sold, and claiming all of them as saved money turns the scorecard into self-congratulation.
Time ROI
Time ROI = gross profit ÷ sourcing hours. This metric puts value on the hours spent driving, scanning, negotiating, and waiting in line. A low-dollar flip with a clean, fast decision may beat a complicated high-ROI item that requires extensive research, repairs, and customer communication.
A flipper earning 25% ROI with a 70% pass rate can outperform one earning 40% ROI with a 15% pass rate over a year if the first operator frees capital and time for better buys. Those figures illustrate the trade-off, not a guaranteed outcome. The result depends on purchase volume, dollar profit, holding time, and whether rejected items would have performed as expected.
Before your next sourcing trip, write down:
- Minimum net profit: The dollar amount that makes the work worthwhile.
- Minimum ROI: The return required for the capital and risk.
- Maximum hold: The longest acceptable wait for the category.
- Pass reason: The specific issue that stopped the buy.
- Review date: When you'll compare the decision with the eventual result.
Don't trophy-hunt high ROI percentages while filling your storage with slow losers. A metric isn't a grade. It's a tool for deciding where your next dollar and hour should go.
ScanFlip AI helps resellers make buy-side decisions with AI photo scans, barcode scans, text search, sold comps, fee-aware net profit estimates, and a flip-or-pass verdict. Use those inputs to test your return on investment assumptions before money leaves your pocket, then visit ScanFlip AI to see how it fits into your sourcing routine.